Reports
Build interactive reports without coding
Reportr has everything you need to put the right data in front of the right people, exactly when they need it.
Query builder
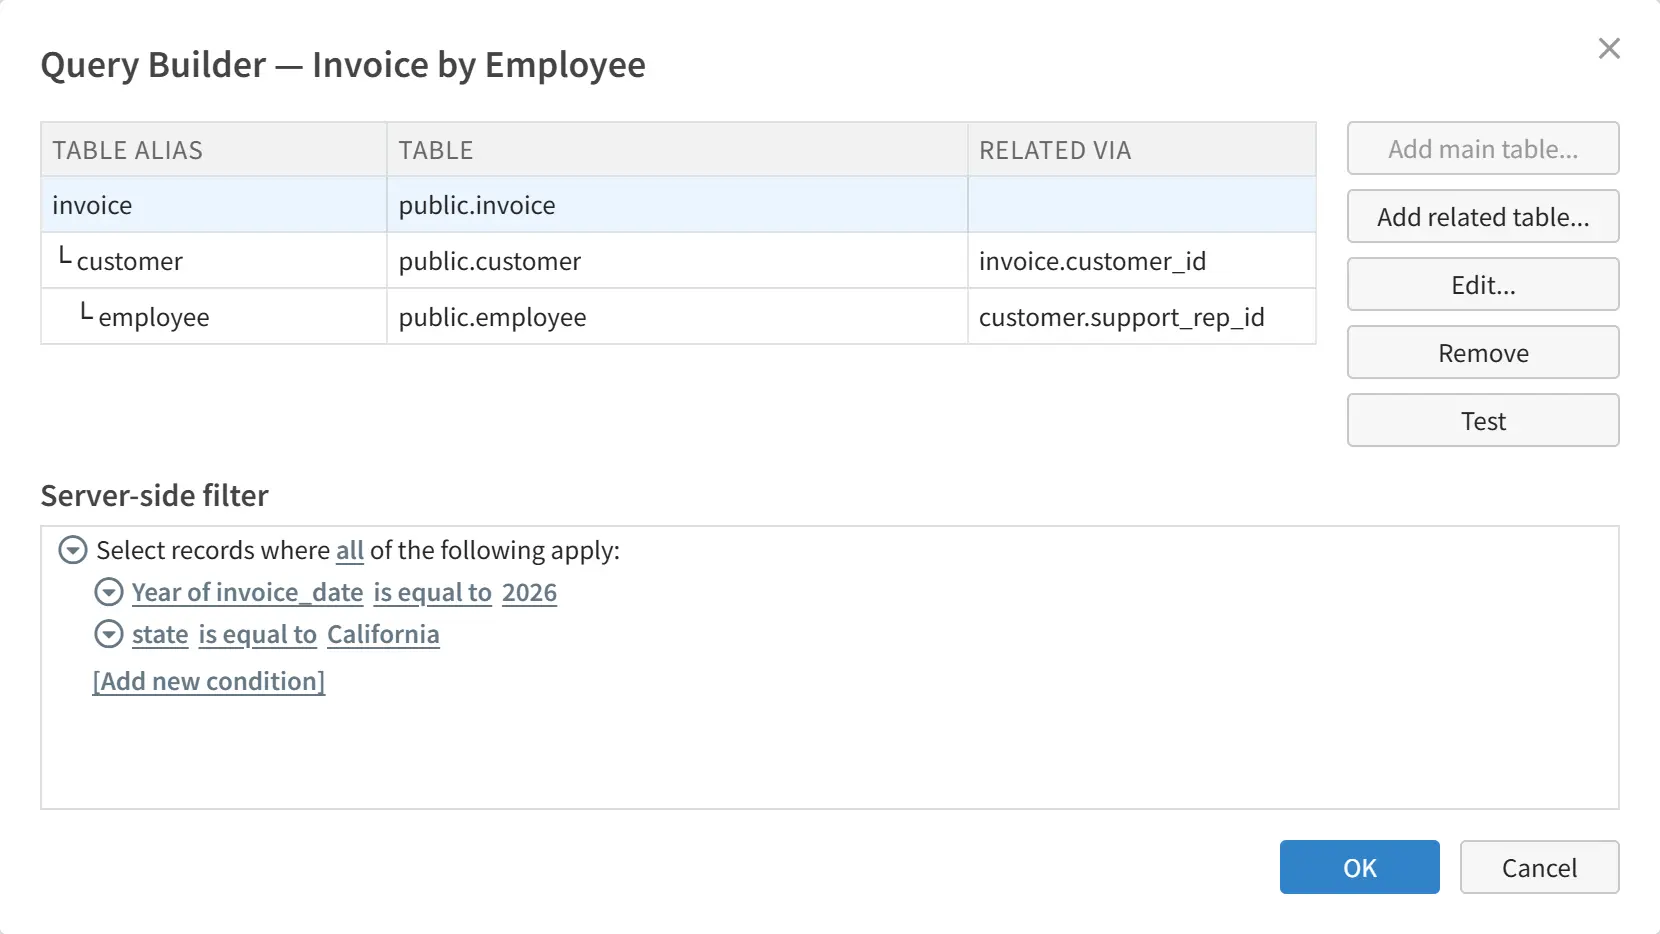
Queries are the fundamental way to request and retrieve specific data from a database. The easy-to-use query builder in Reportr helps you build correct queries without making common errors known as "fan traps" and "chasm traps".
Powerful parameter prompting
You can use query parameters to determine which subset of data is displayed in the report. Reports can have multiple query parameters. To insert query parameters, use our easy-to-use query builder. No SQL knowledge necessary.
Query parameters can be multi-valued, for example you can supply the values California, Oregon and Washington for the state parameter. Query parameters can also be cascading, meaning the value selected in one dropdown determine the values offered in the next dropdown.
Tablular reports
In a tabular report, data is organized in rows and columns, similar to a spreadsheet. In Reportr, a tabular report can display up to 100,000 records at a time. Data is not paginated. Instead you can instantly scroll over 100,000 records, just like in a spreadsheet.
If you have millions of records in your database you can use query parameters to decide which subset of data to display in the report.
End-user grouping and sorting
Rows in a tabular report can be grouped, and subtotals can be displayed for each group. You can nest groups (for example, subcategories inside categories), and there is no preset limit to the number of levels groups can be nested. End users can change the grouping to suit their needs.
You can collapse and expand groups.
Tables can be sorted on multiple columns, and end users can change the sorting to suit their needs.
Groups can also be sorted. Groups can be sorted on the group caption field, or they can be sorted on totals.
Powerful end-user filtering
You can filter data in the report using simple conditions, for example, City = Seattle.
You can also filter data based on multiple conditions, all of which must be satisfied. For example, finding all sales transactions that occurred in both January AND involved products from a specific category.
You can also combine conditions using the OR operator. This allows you to filter data to include records that meet at least one of multiple criteria. For example, identifying all customers who either made a purchase last year or have a loyalty card.
Sometimes you need more sophisticated filtering where you combine multiple conditions using AND or OR operators. For example you might need to find all employees who work in the Sales department AND have a tenure of more than five years OR hold a managerial position.
This is trickier because there may be multiple ways to interpret a compound condition that combines AND and OR operators. Reportr displays such compound conditions in a hierarchical fashion to avoid misinterpretation.
Instant full-text search
Reportr supports performing full-text search on the report (as opposed to the entire database). Full-text search allows you to quickly find records based on partial information, regardless of which field contains the data.
Reportr updates the screen as you type, and highlights the matching text. As you type, totals are also instantly updated to only include matching records.
Summarize data using charts
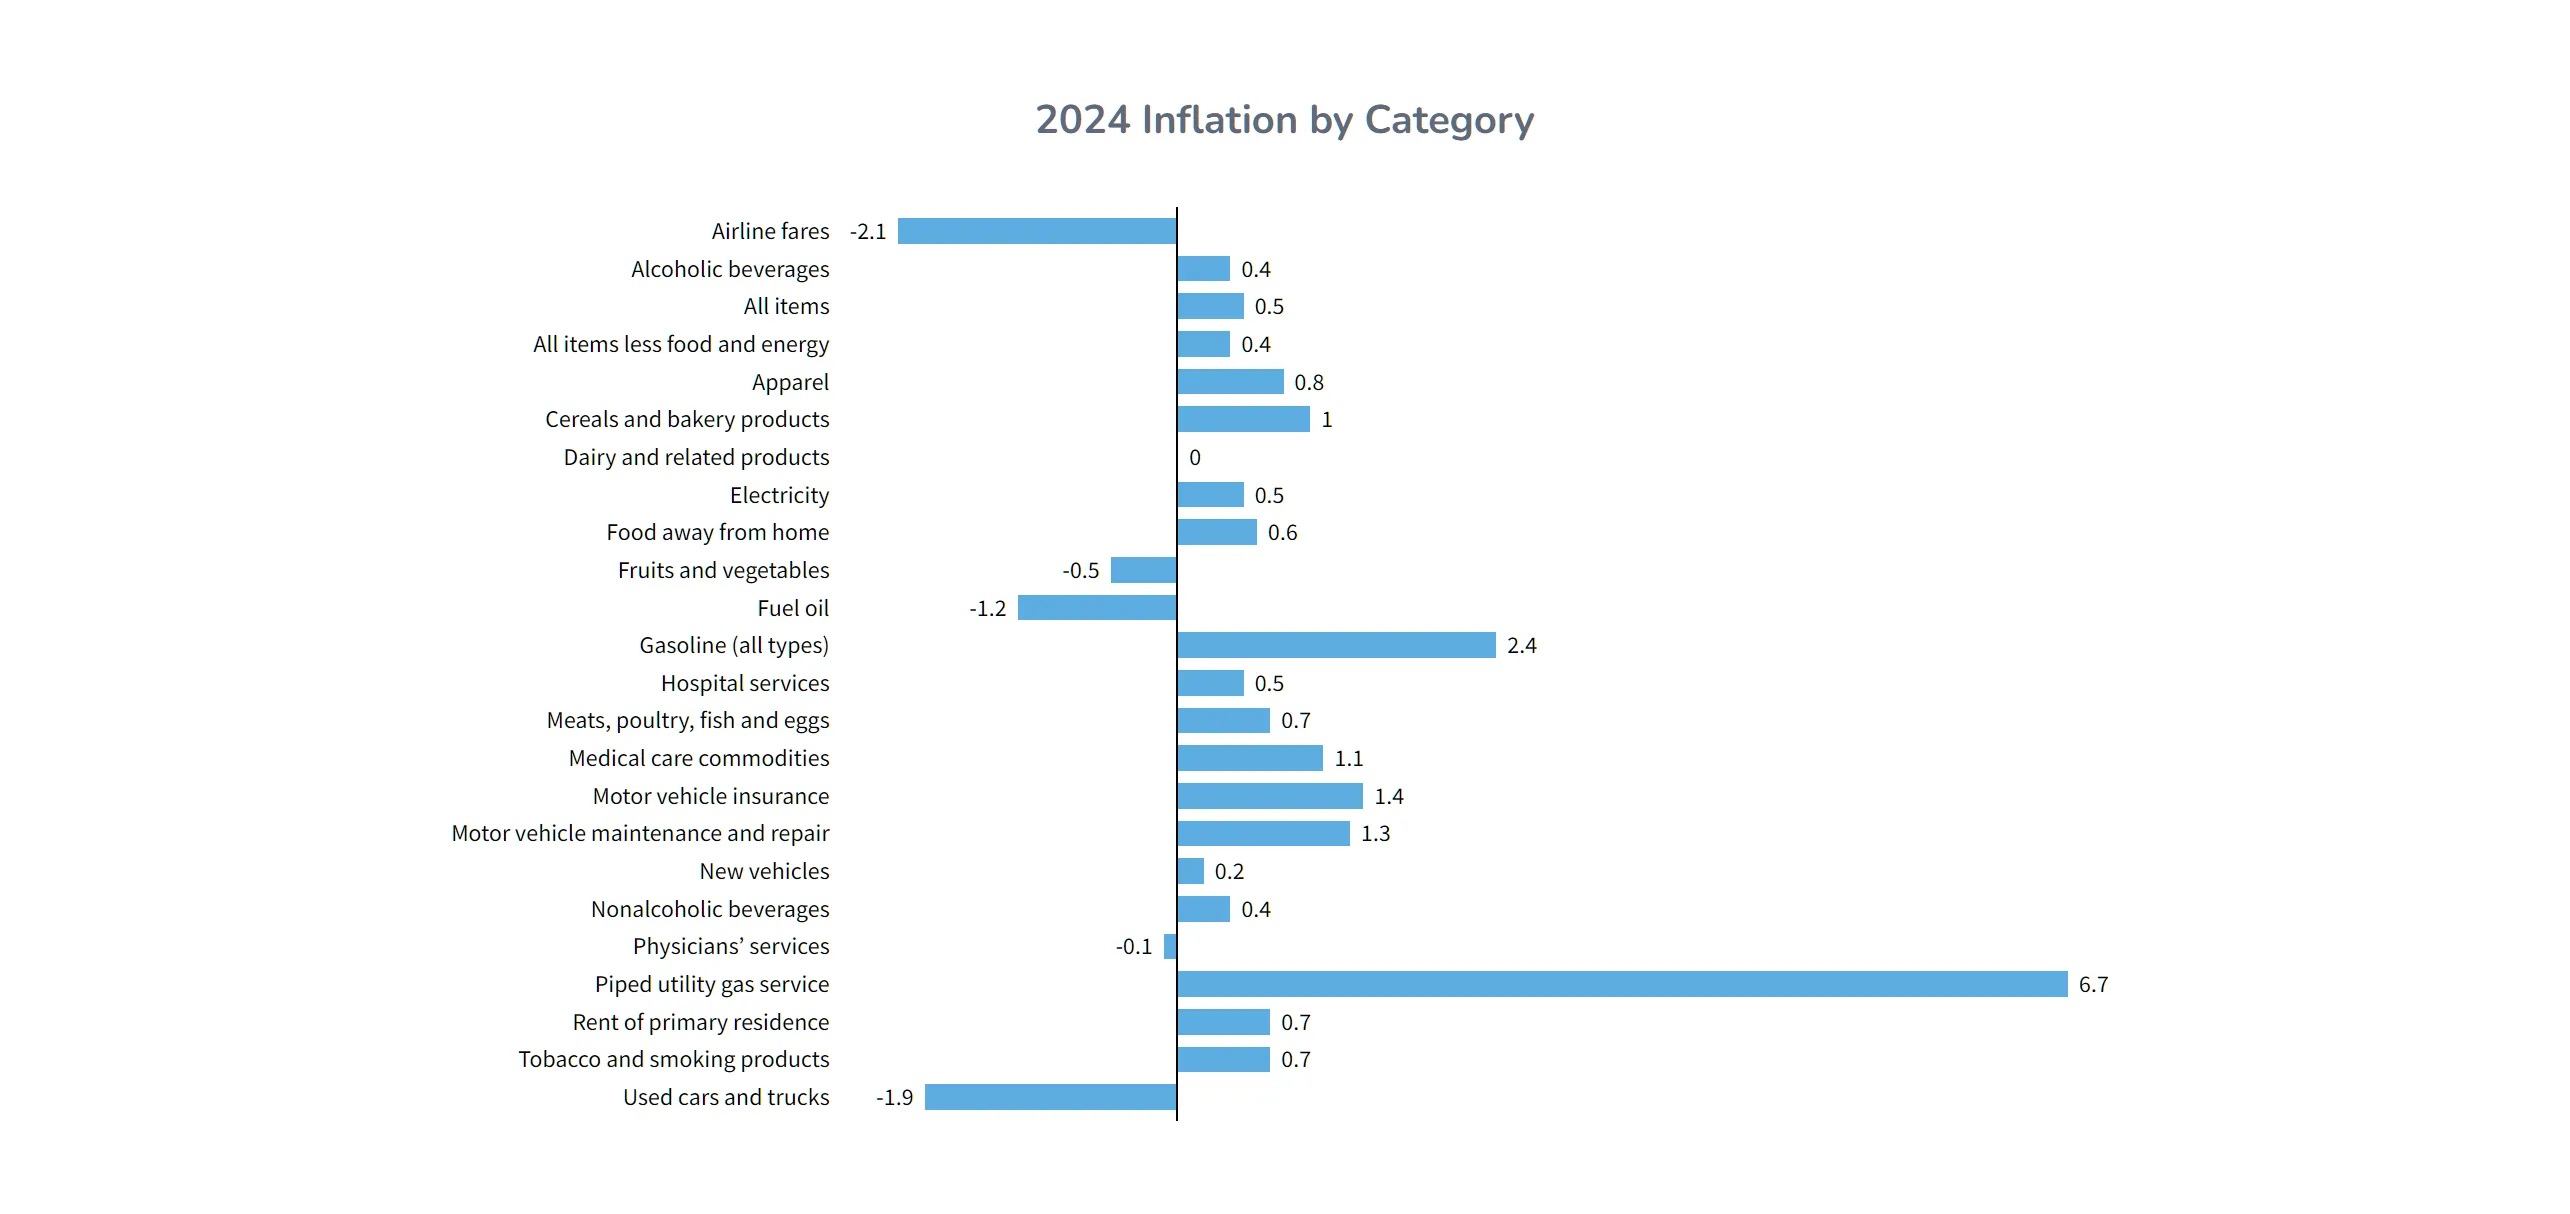
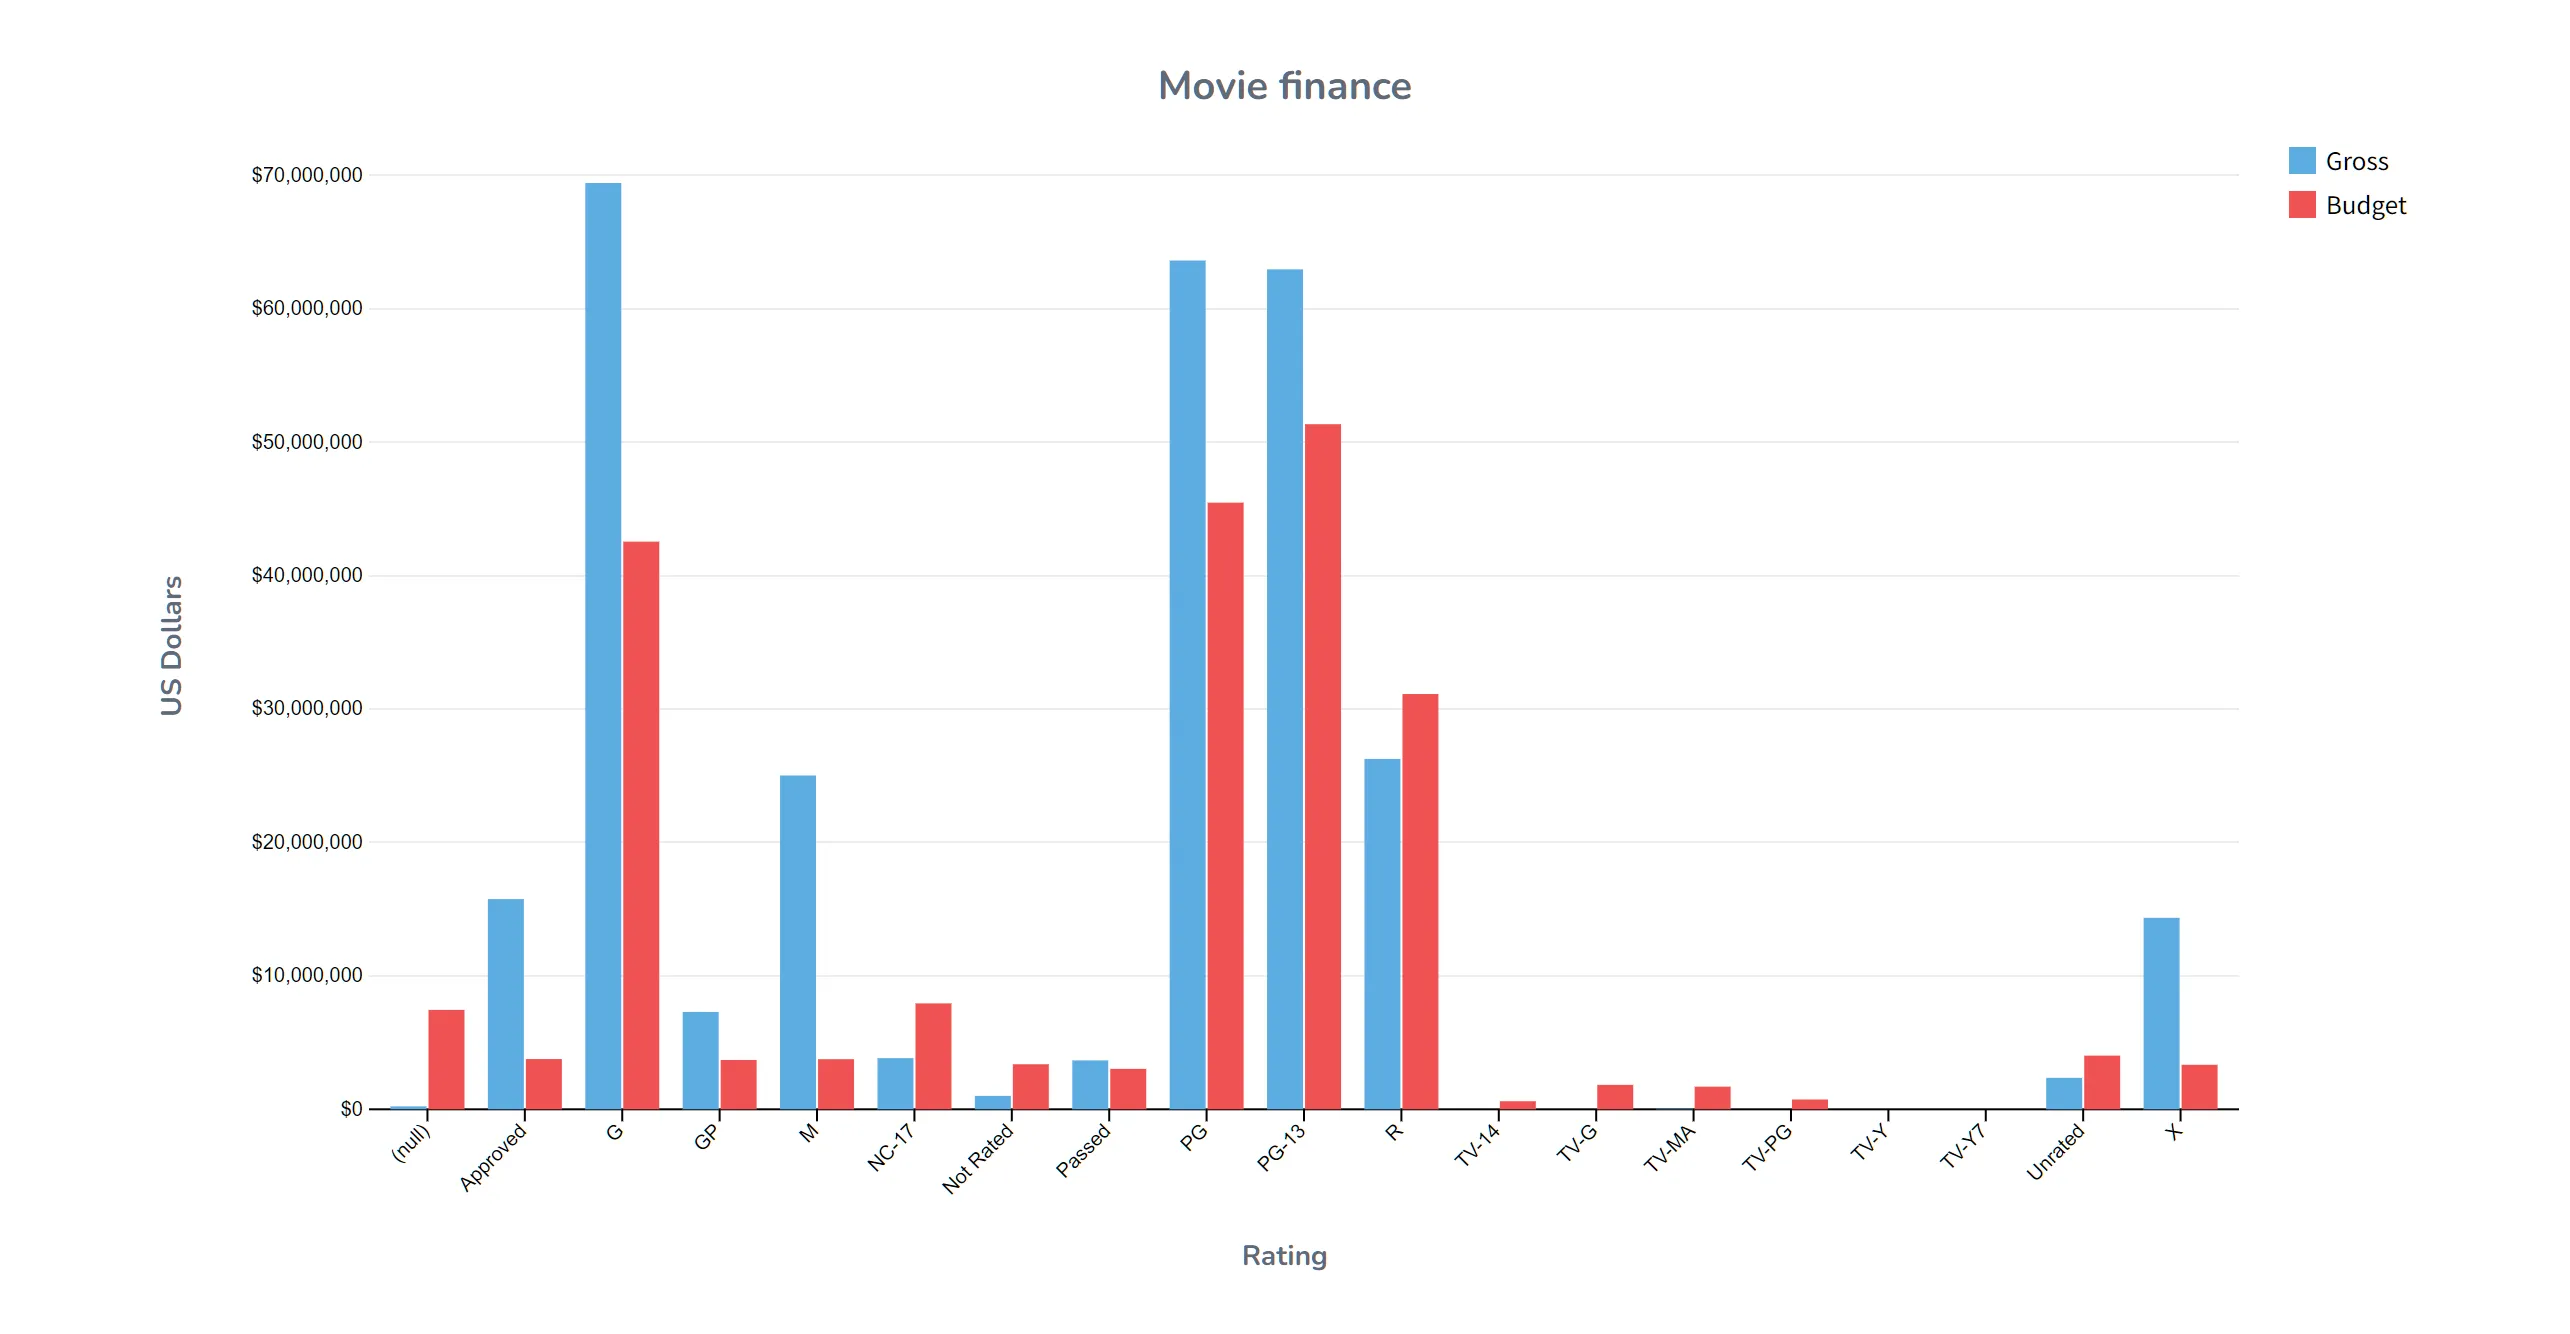
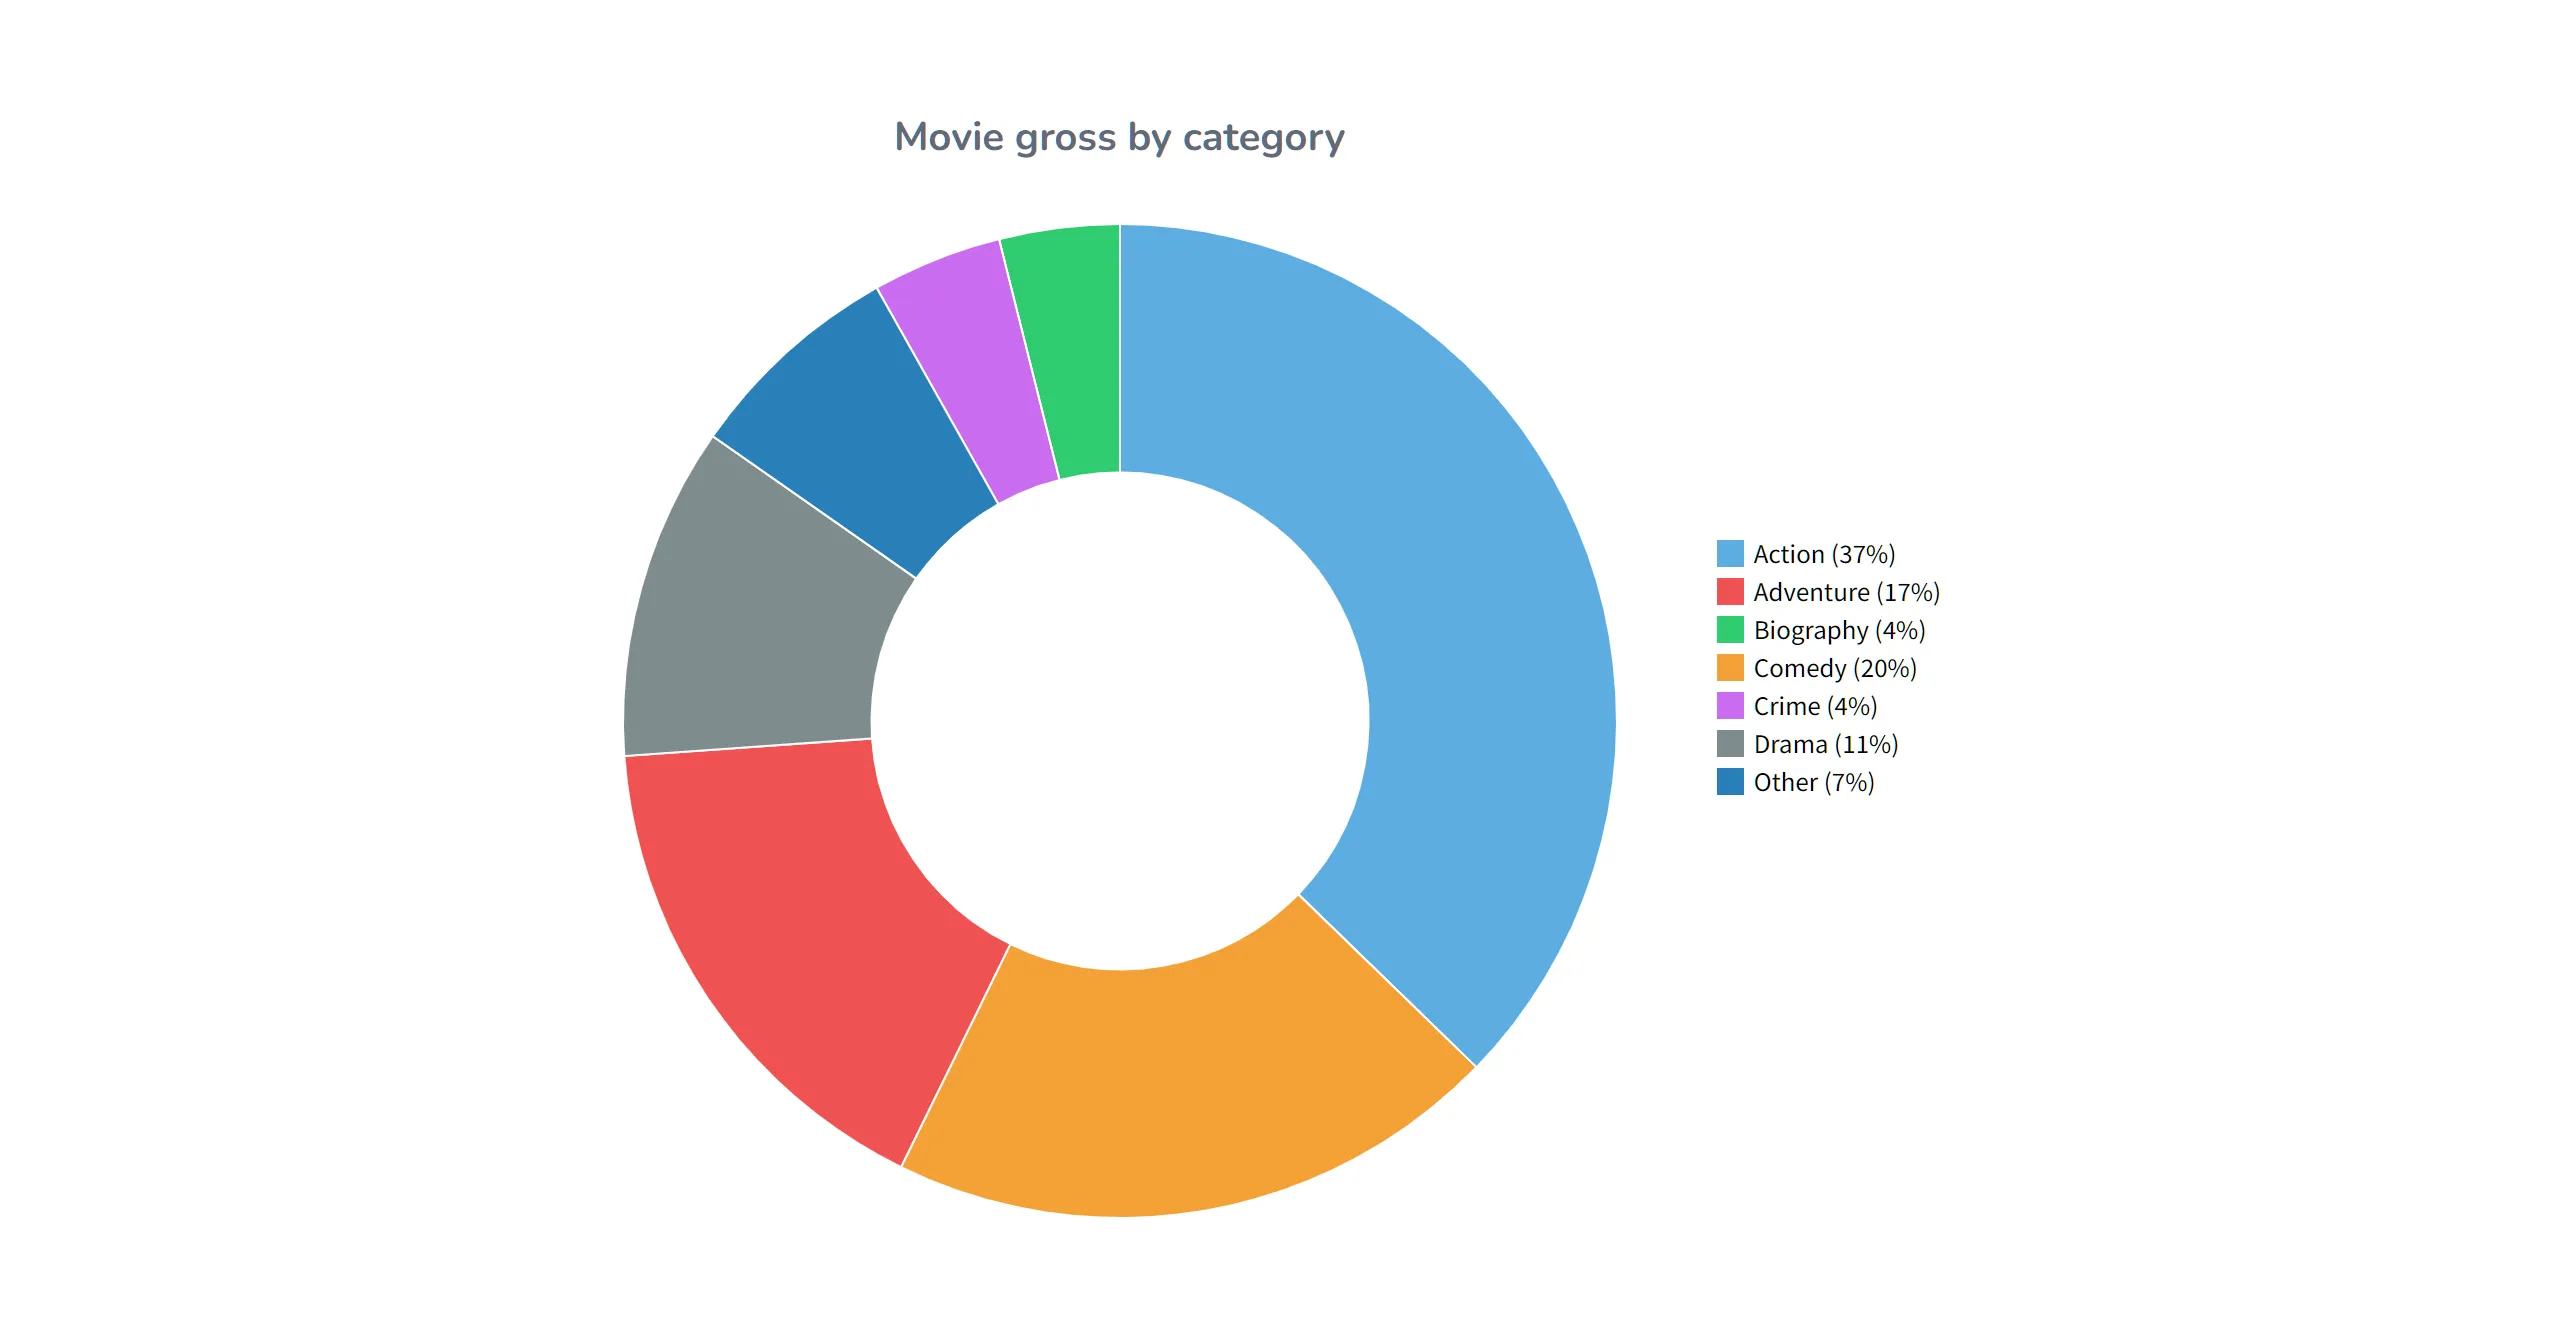
Reportr supports summary charts. A summary chart (also known as a pivot chart) is different from a regular chart in that it aggregates data and plots the aggregated values. For example, you can display sales as a bar chart with Product on the category axis and Region on the series axis. Reportr calculates aggregate sales for each product and for each region, then displays these aggregate sales in the chart.
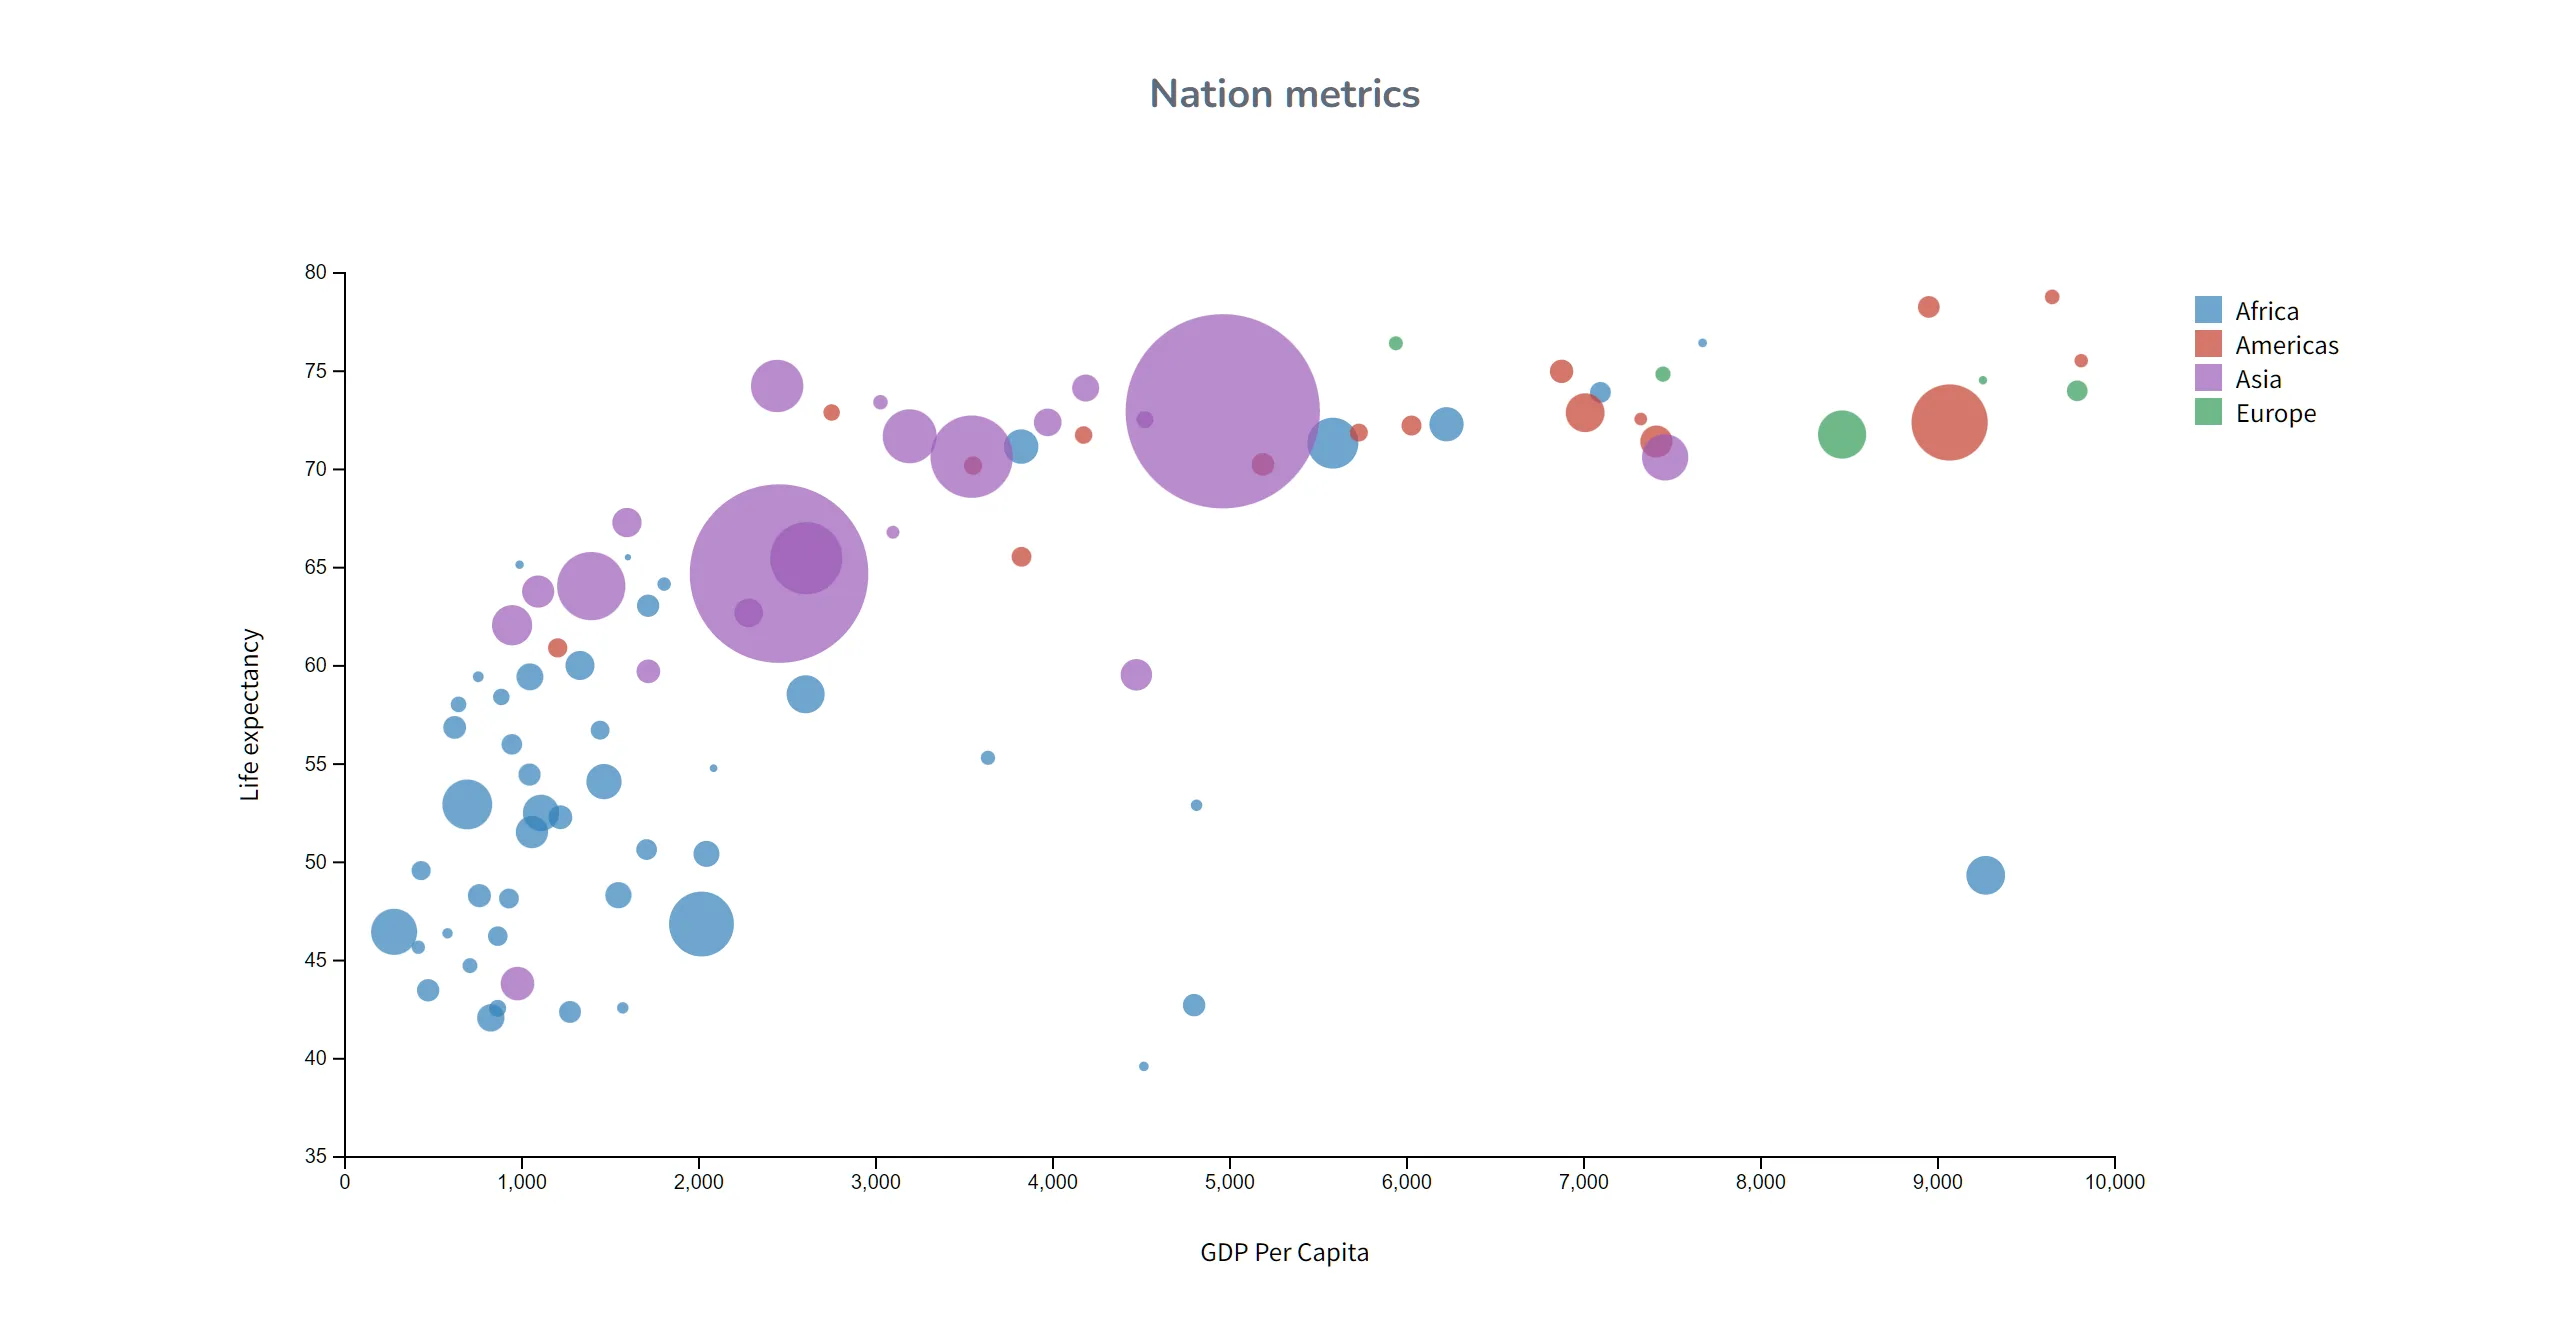
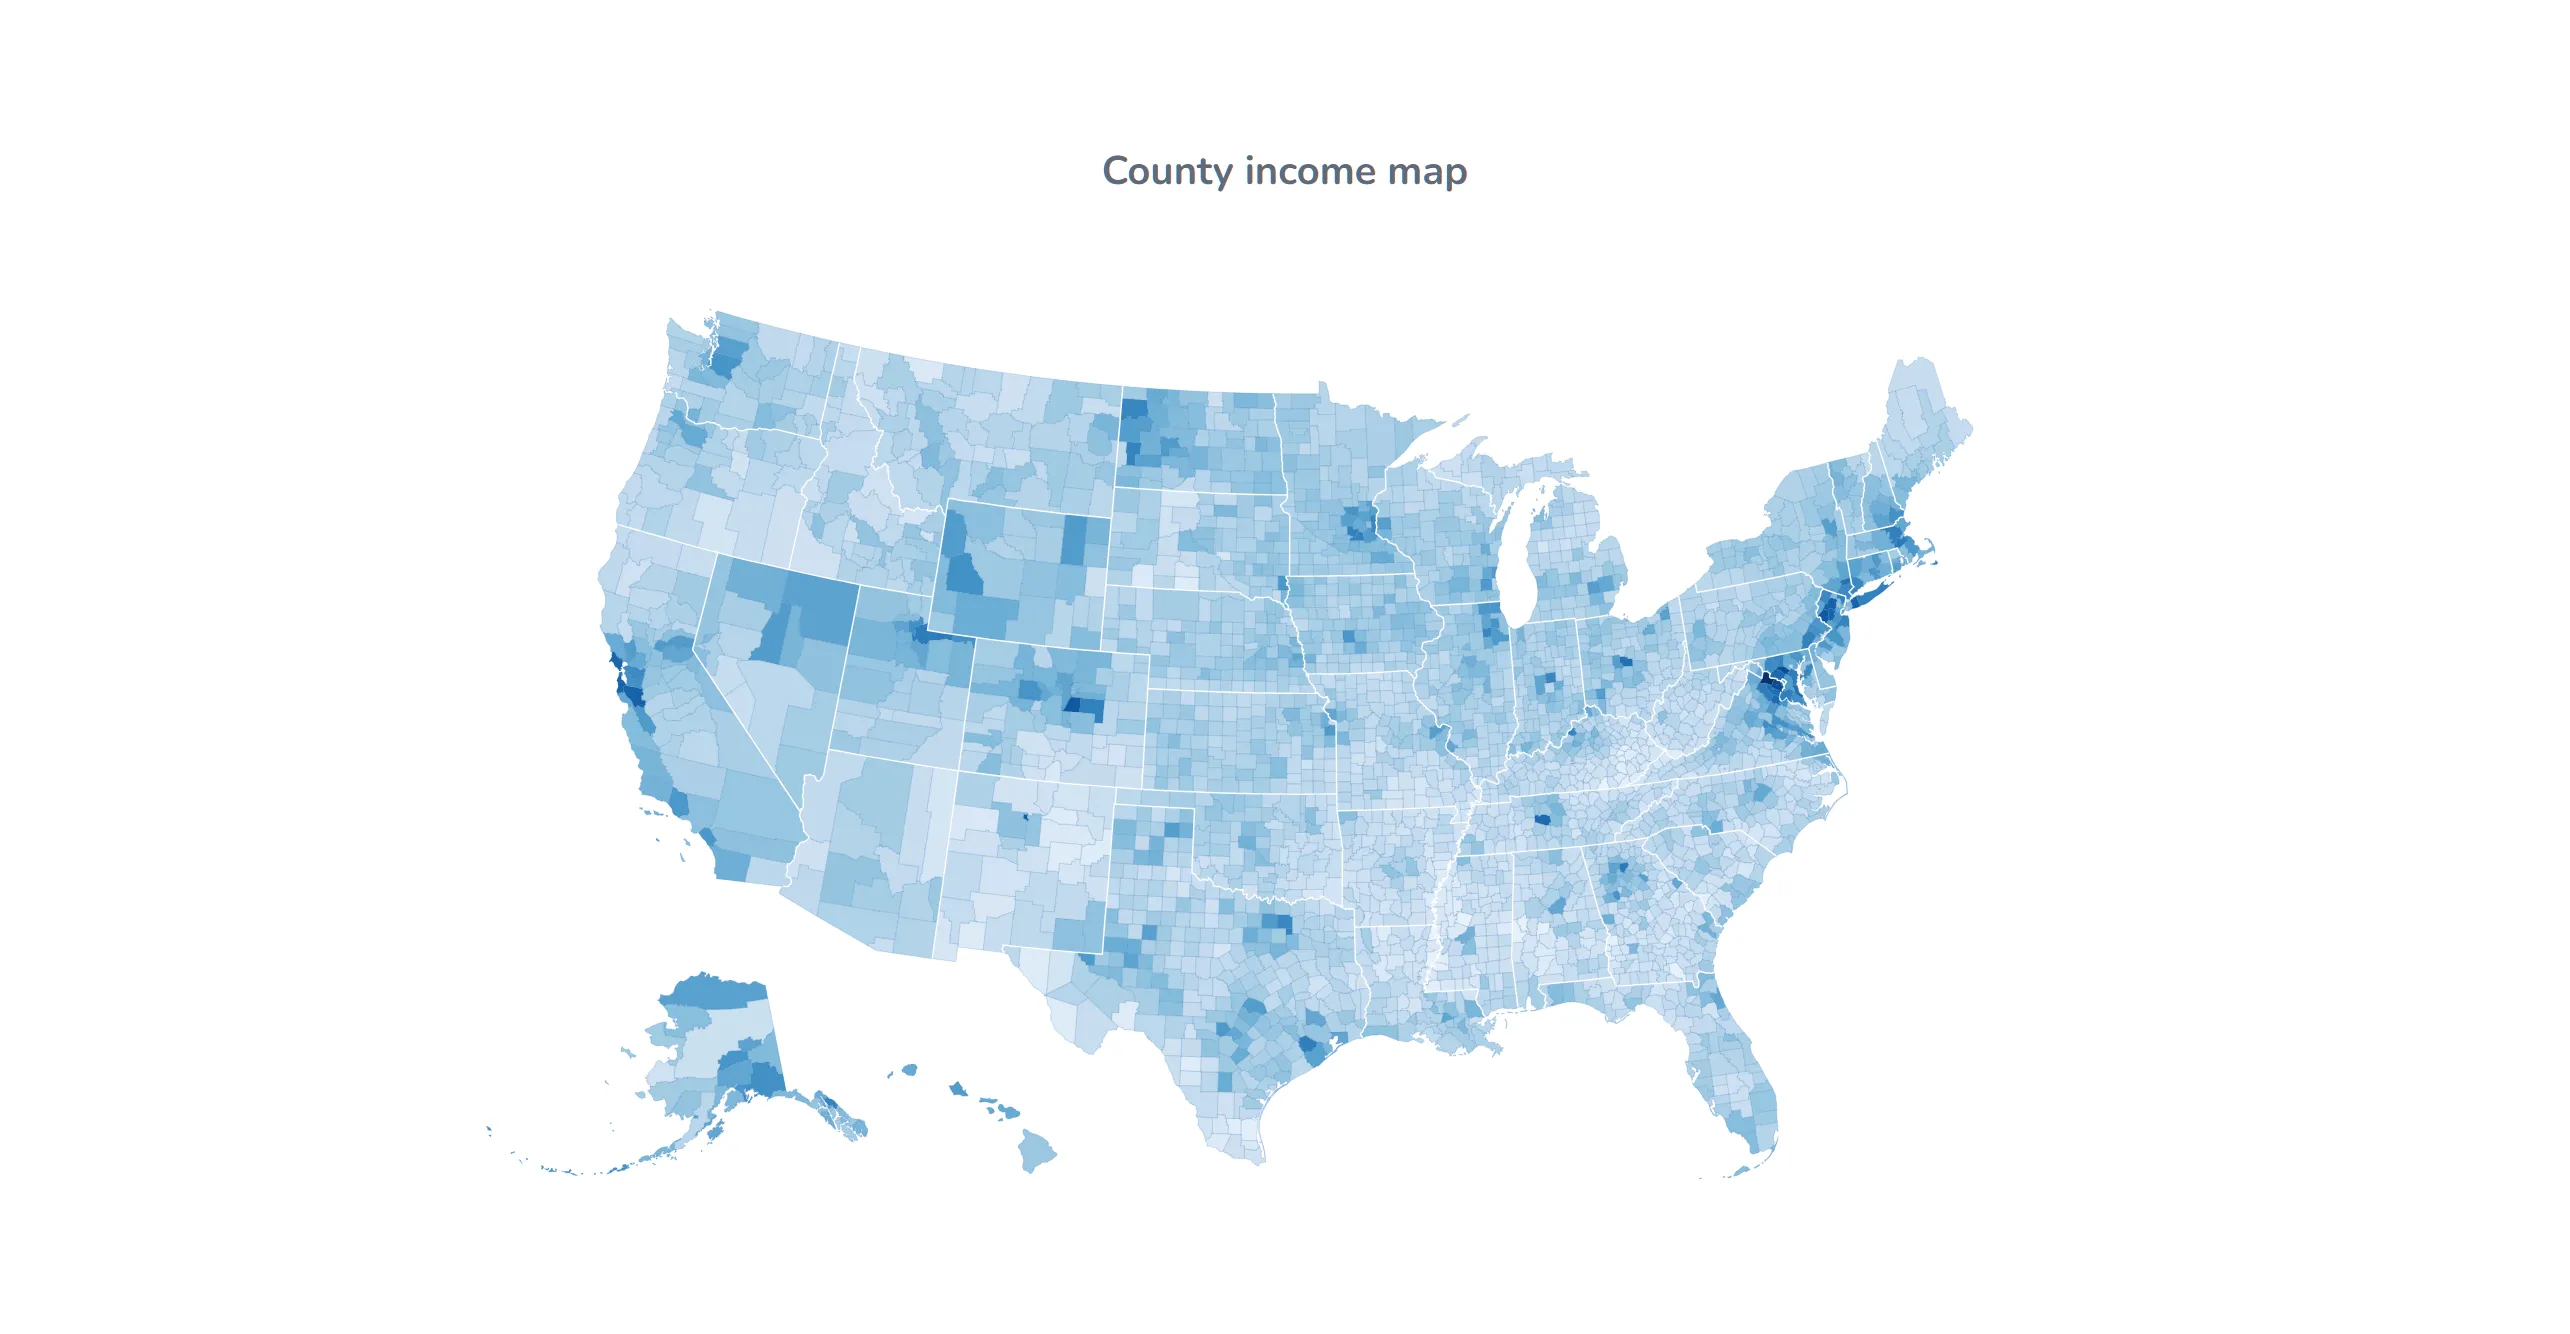
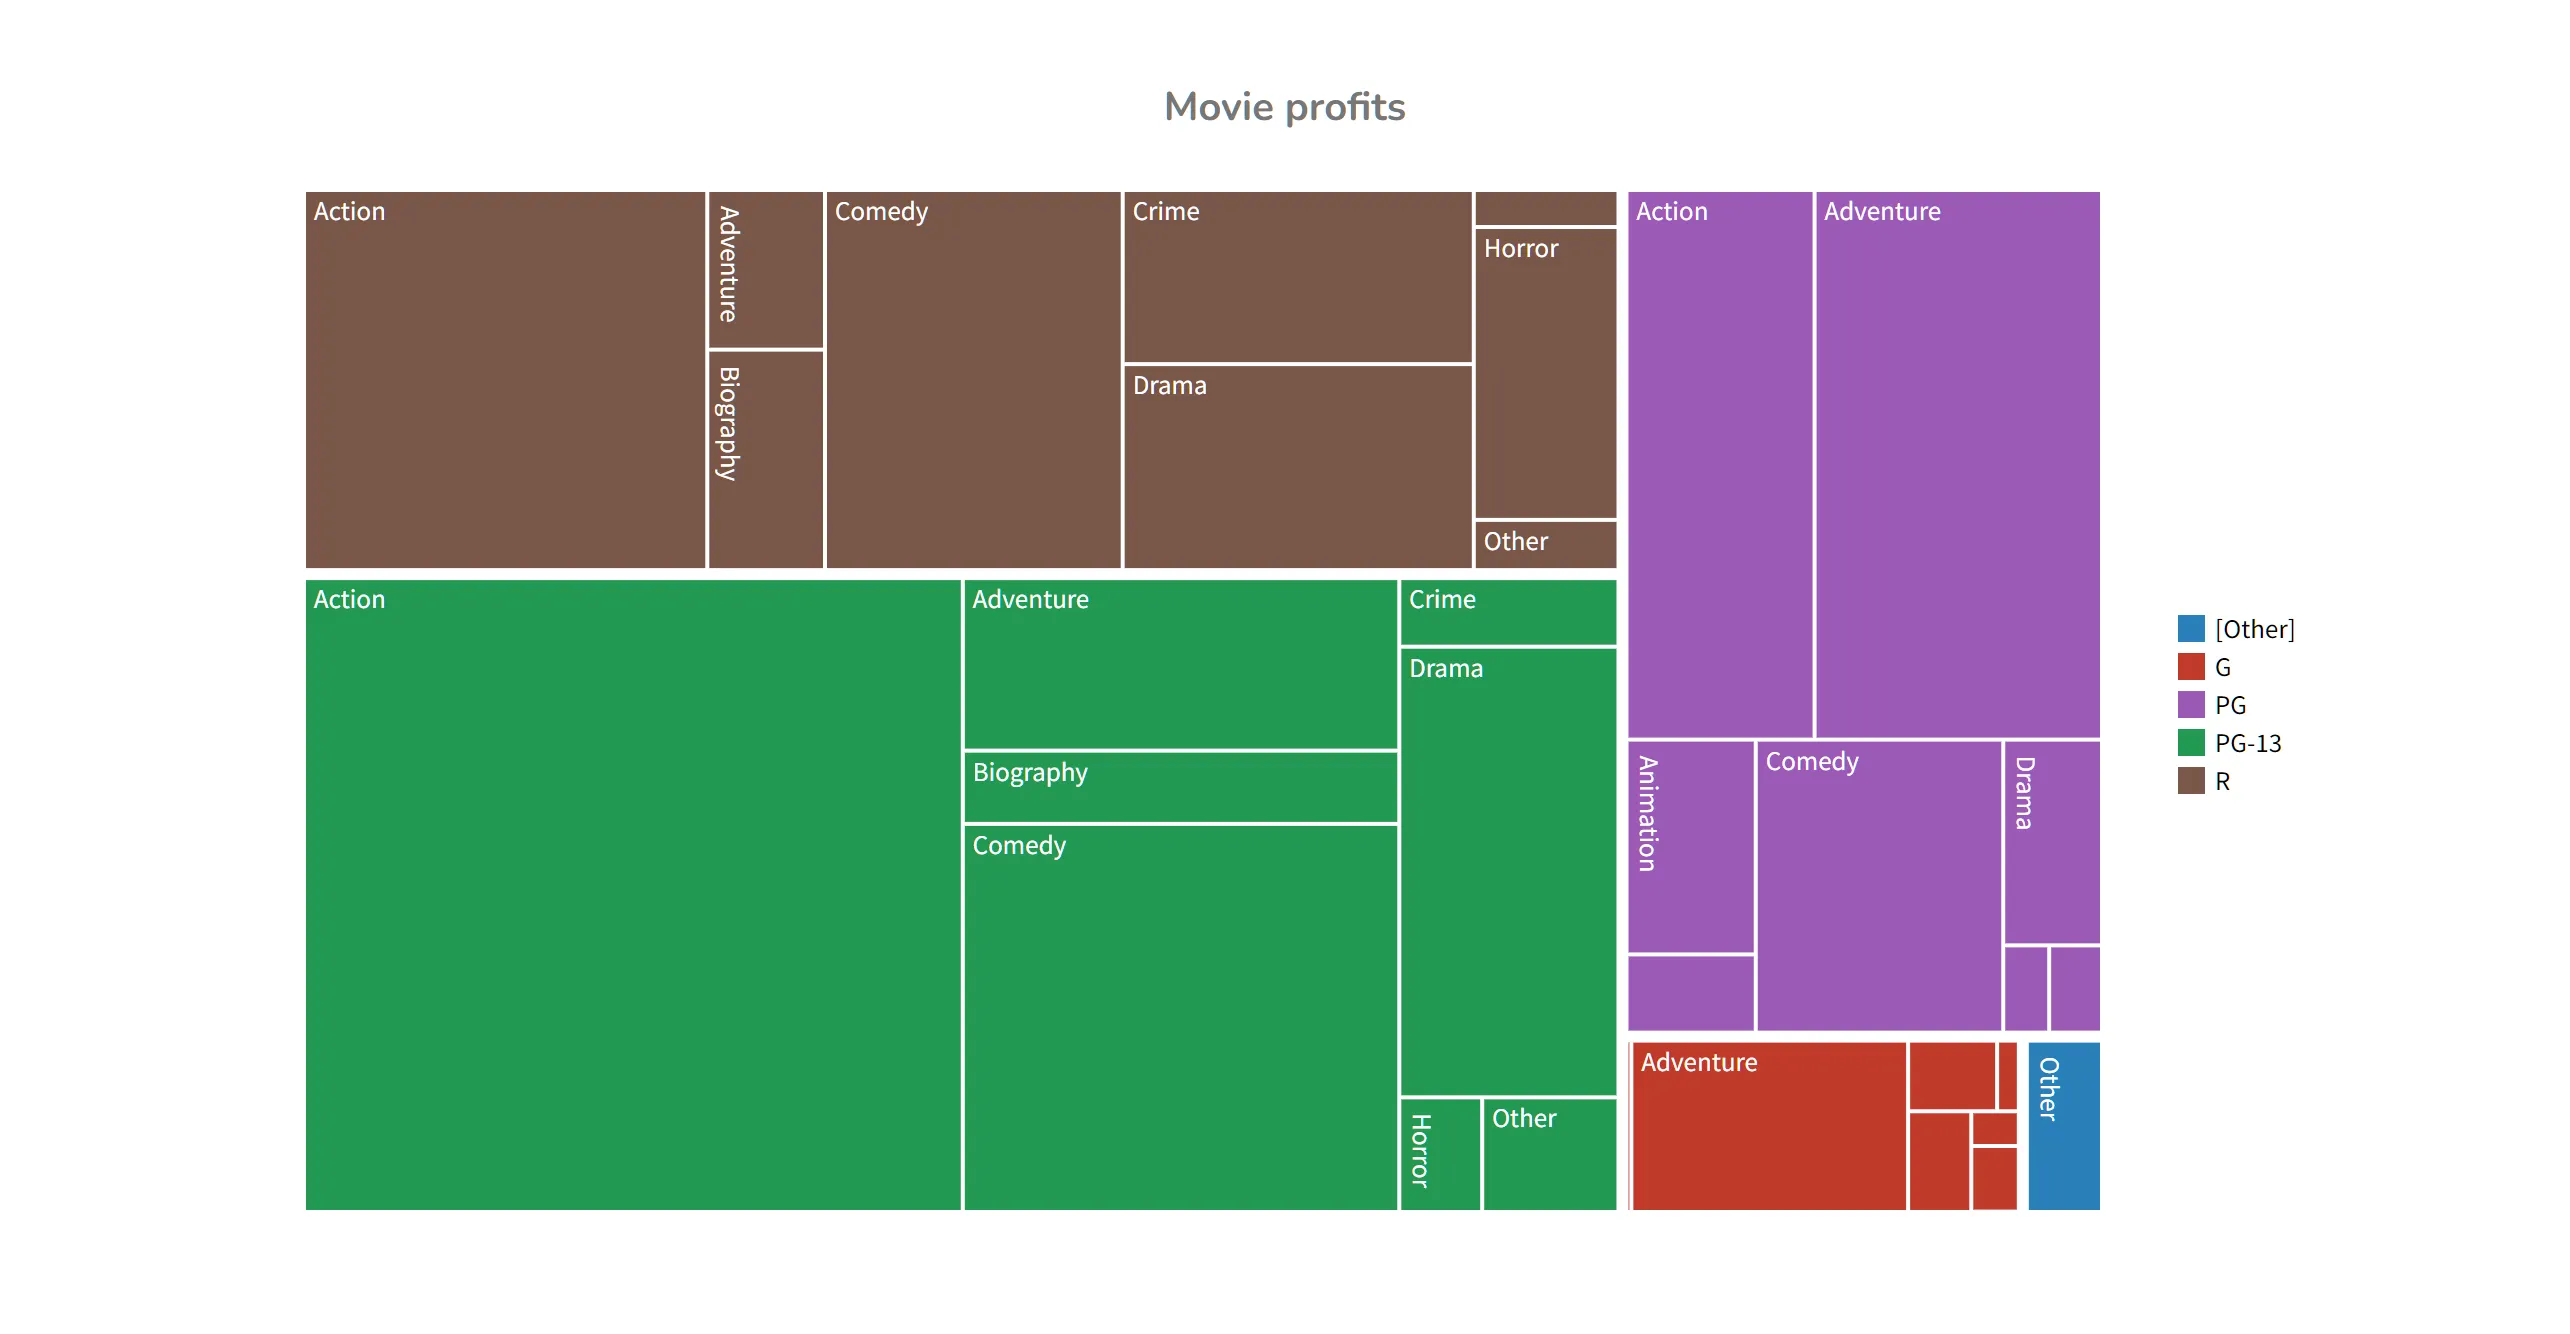
Reportr supports a large number of chart types including column and bar charts, pie charts, treemap, choropleth, scatter and bubble charts etc.
Time series analysis
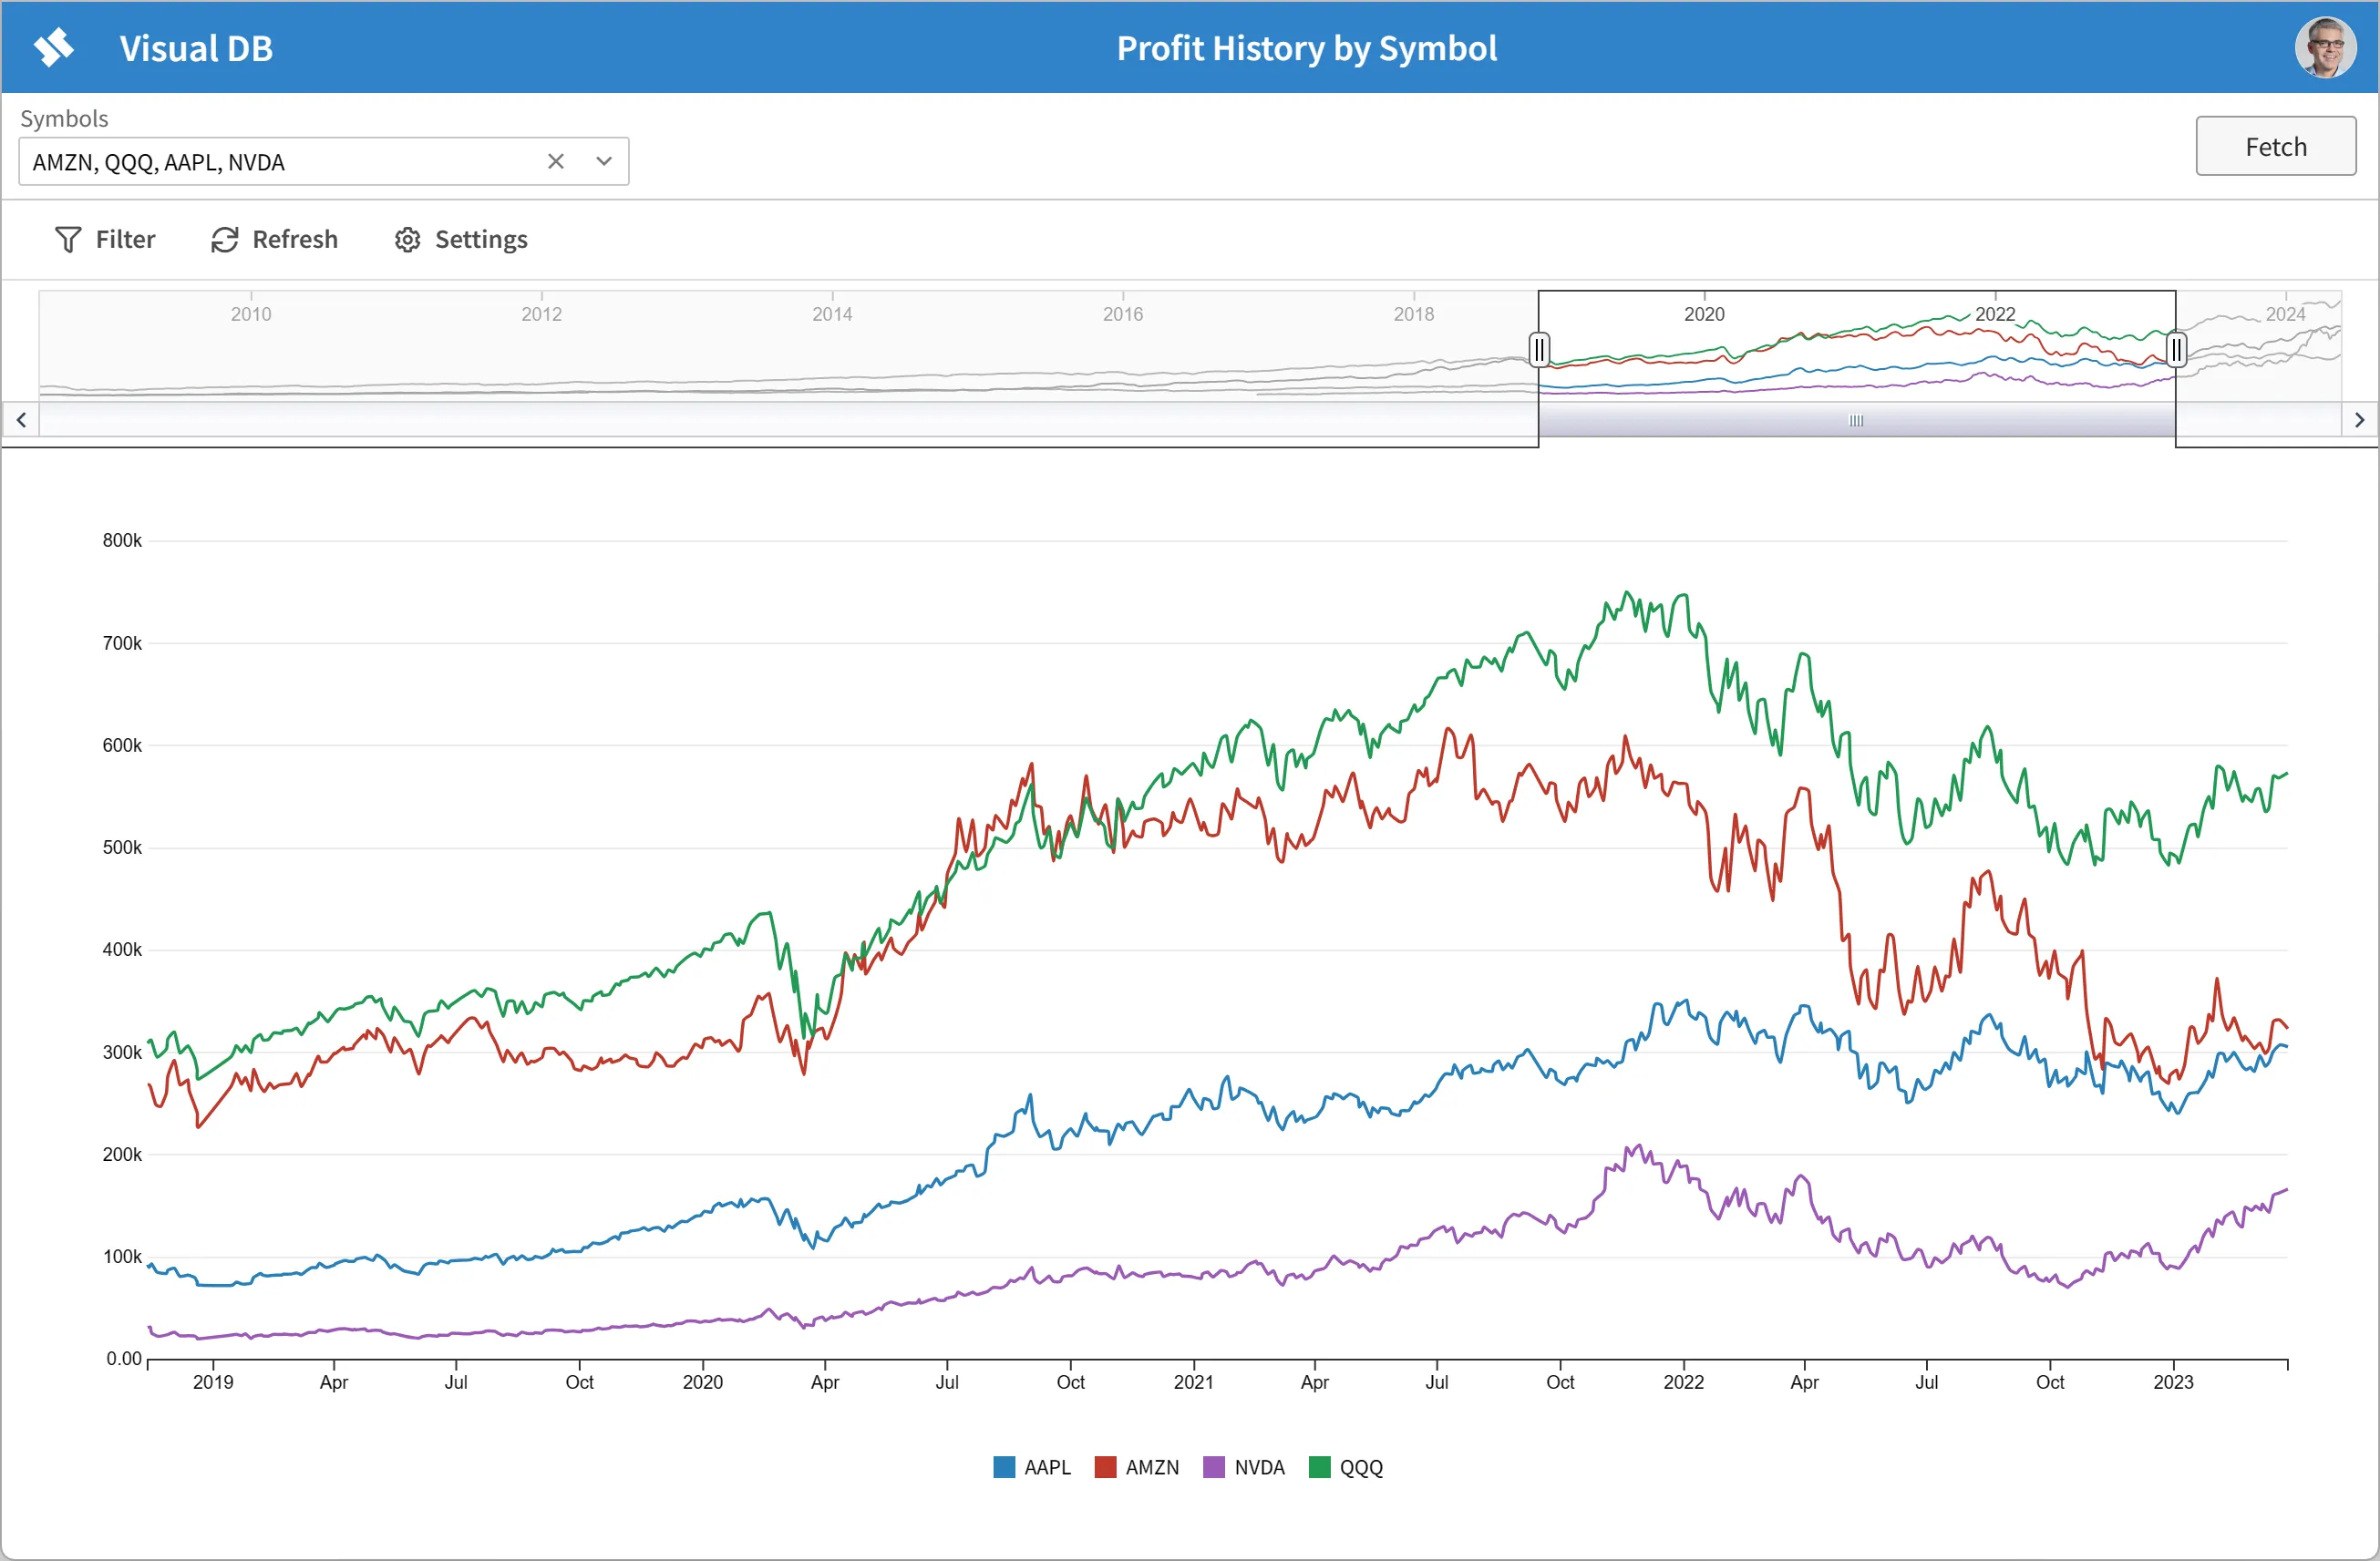
Perhaps the most important chart type for business use cases is the time series chart. For example, you may want to know how sales have performed over the last 12 months. Time series charts plot changes in a value over time. Reportr offers excellent support for time series charts. After the chart is displayed, you can zoom in on a specific time period or slide to a different time period.
Ready to dive in?
Join thousands of teams already boosting their productivity with Reportr