Reporting and analytics using natural language
Chat with your database. Save insights as refreshable reports.
Explore your data by chatting
Your database knows more than you think. Reportr gives you an AI chat interface to ask questions, uncover trends, and visualize results.
Conversational data exploration
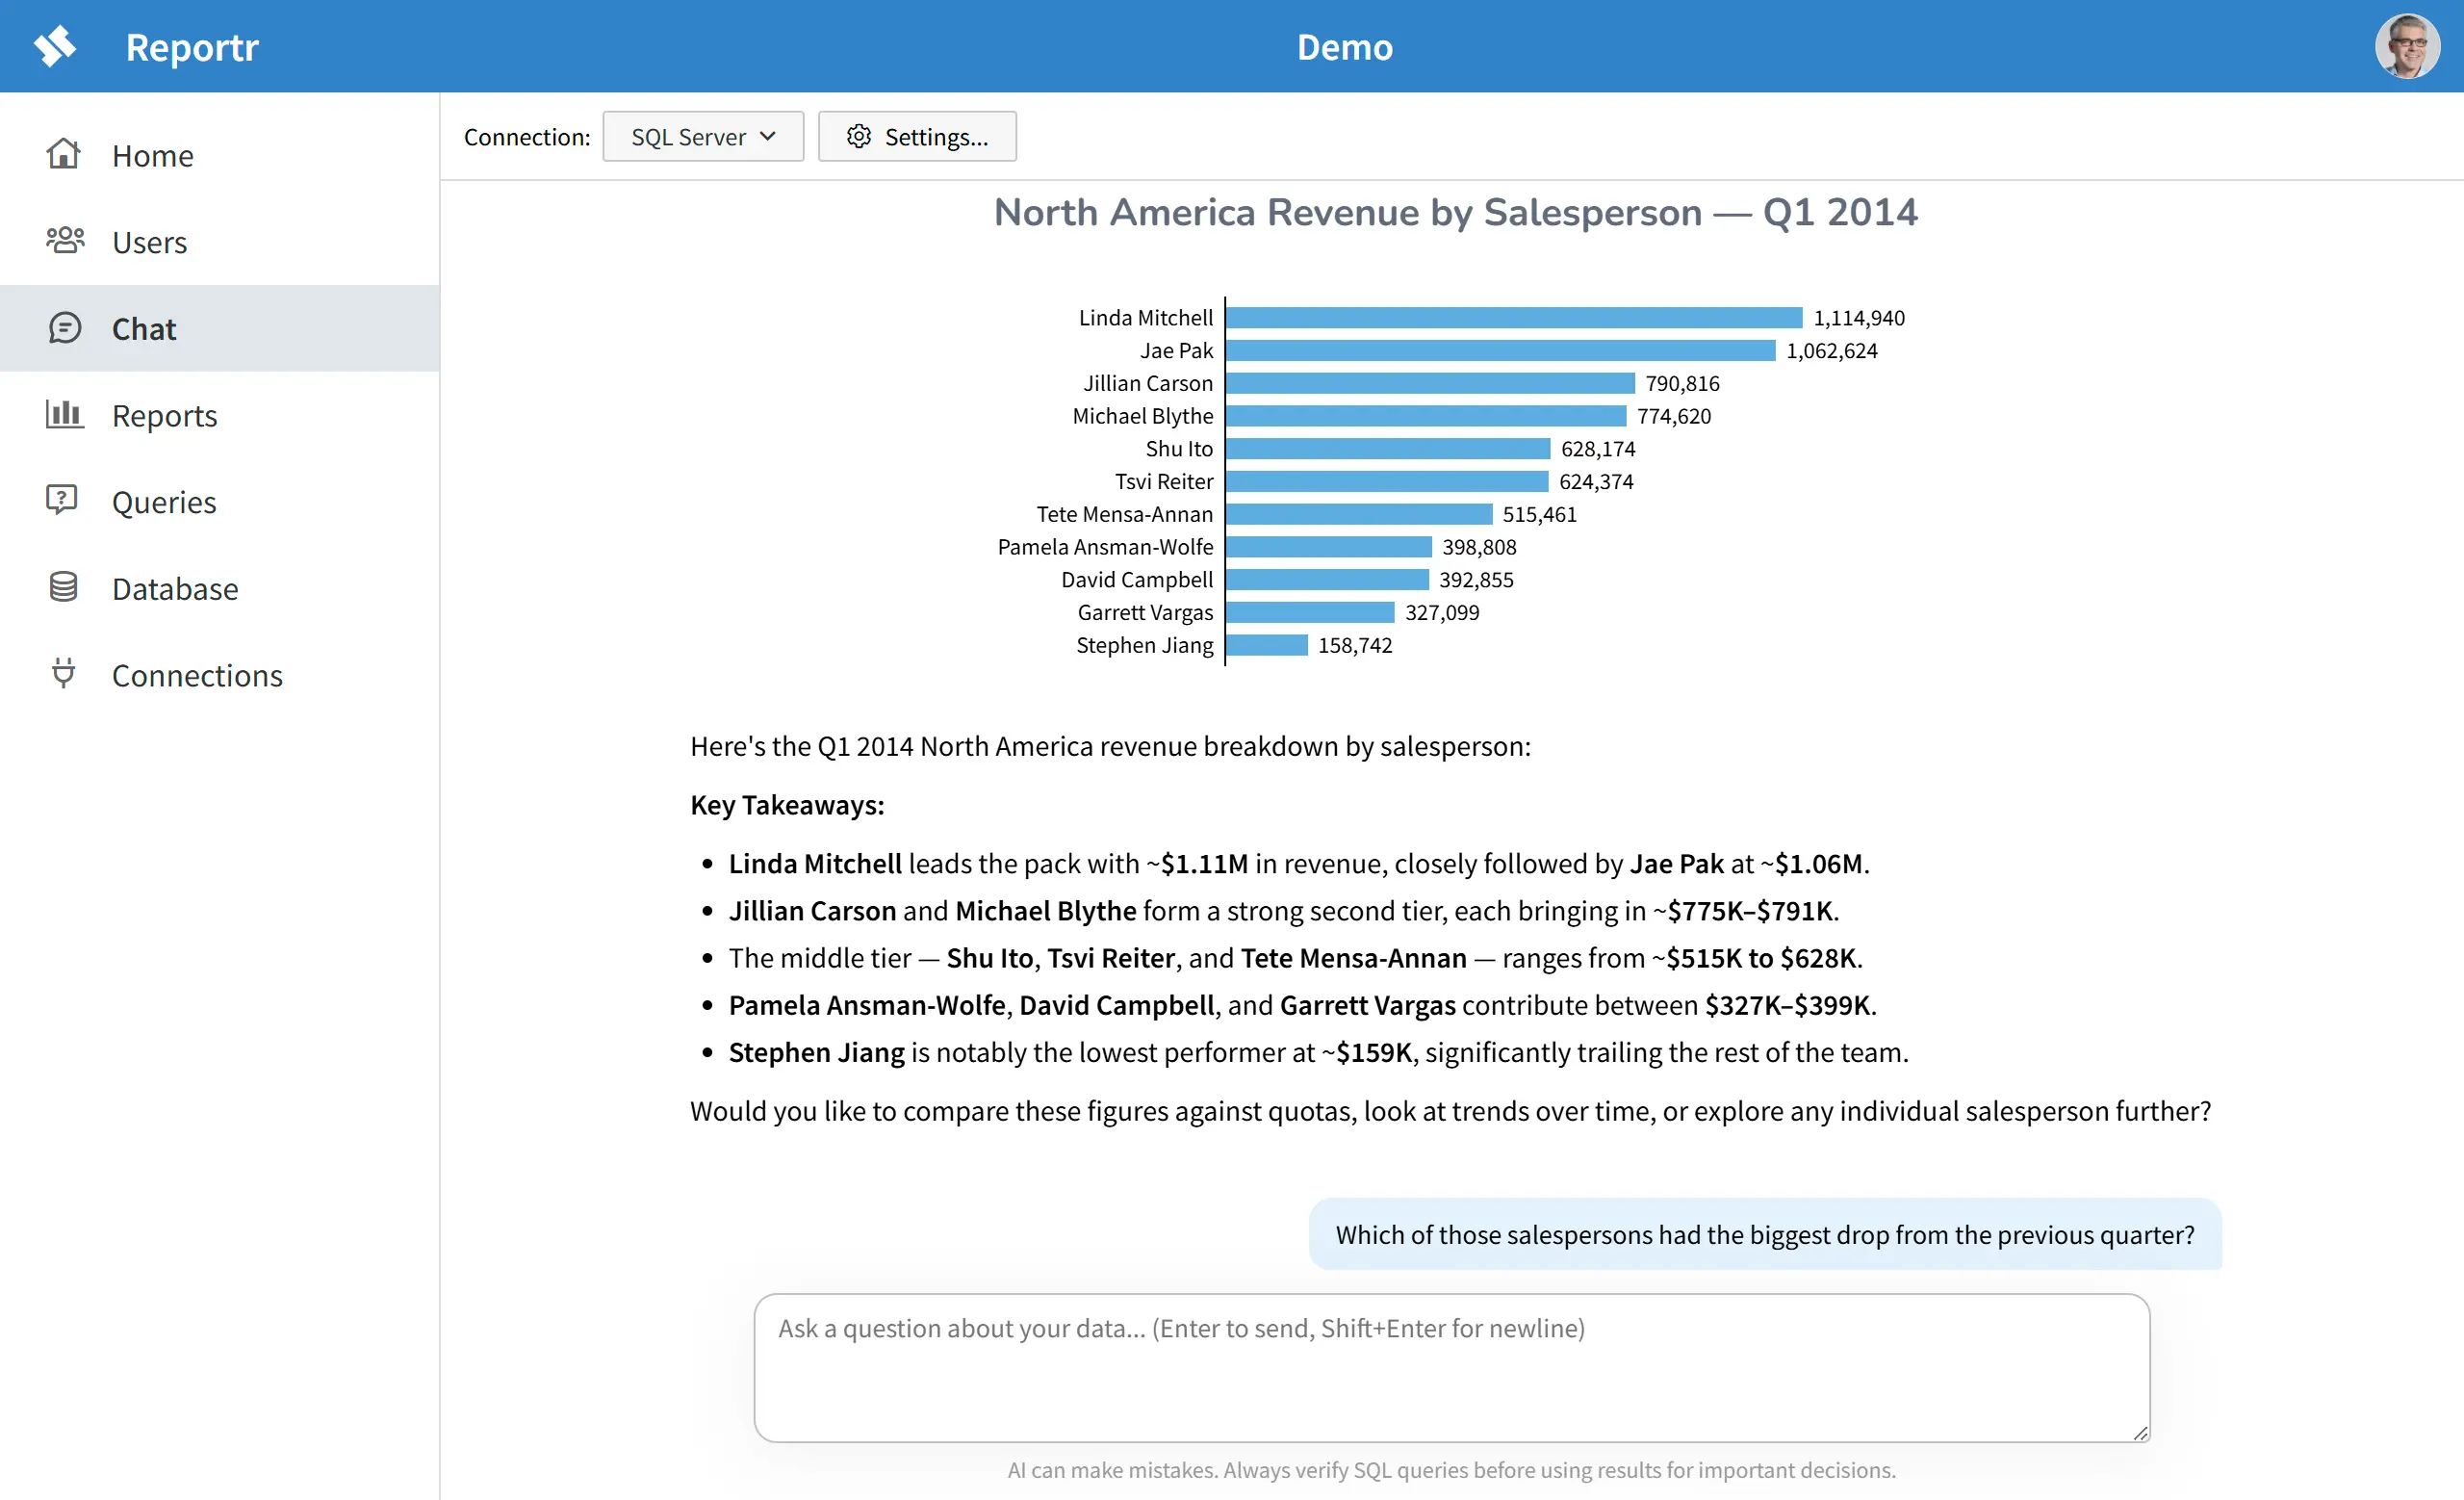
Reportr's chat works the way you think — as a conversation, not a one-off query.
Ask a question, then follow up. Drill down, compare segments, spot trends, and refine your analysis. AI carries the full context of your conversation forward, so every follow-up builds on what came before — no re-explaining, no starting from scratch.
Example flow: "Show me revenue by region for Q1." "Now break down North America by salesperson." "Which of those salespersons had the biggest drop from last quarter?"
Insights you didn't know to ask for
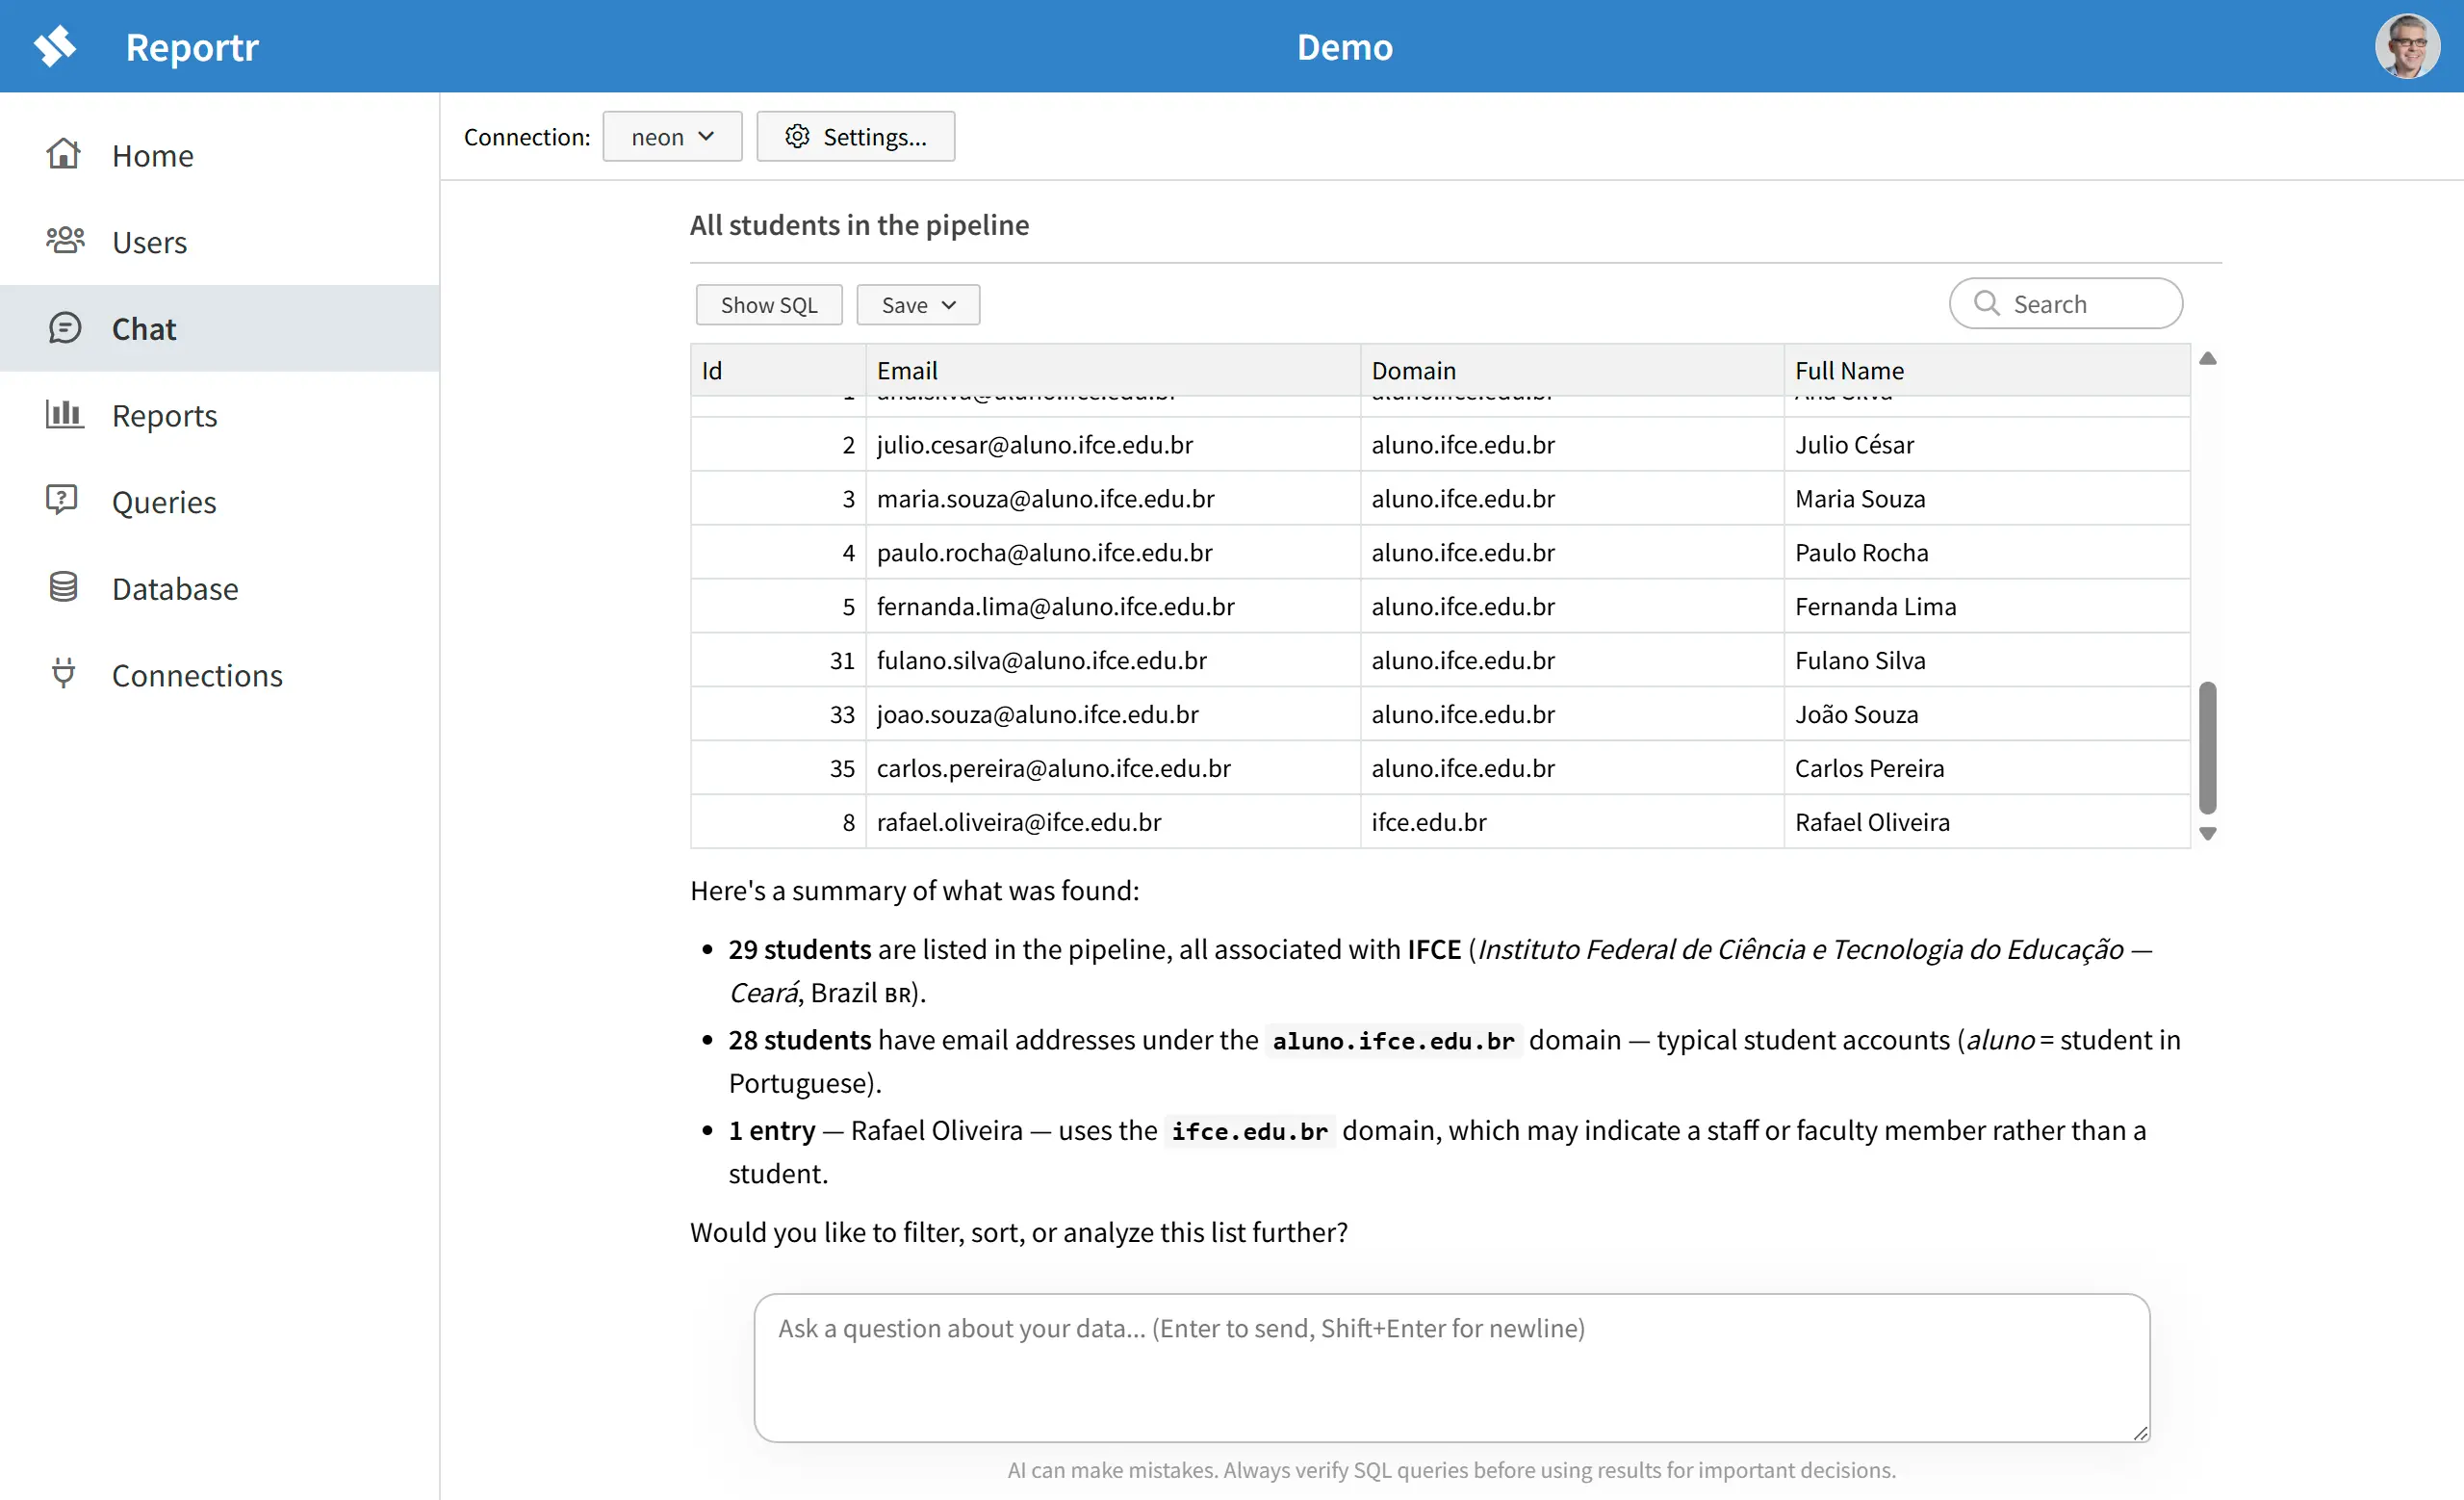
Reportr doesn't just answer your questions — it surfaces what your data is telling you.
Because AI combines what's in your database with its broader knowledge of the world, it can surface patterns, anomalies, and context that you might never have thought to query. Industry benchmarks. Seasonal expectations. Correlations that only make sense if you already knew to look for them.
Example: "Show me all students in the pipeline." Reportr returns the list — and then explains what it found: that aluno is Portuguese for "student," that the domain points to IFCE — a federal technical institute in Ceará, Brazil — and that one entry appears to use a staff domain rather than a student domain.
Agentic analysis
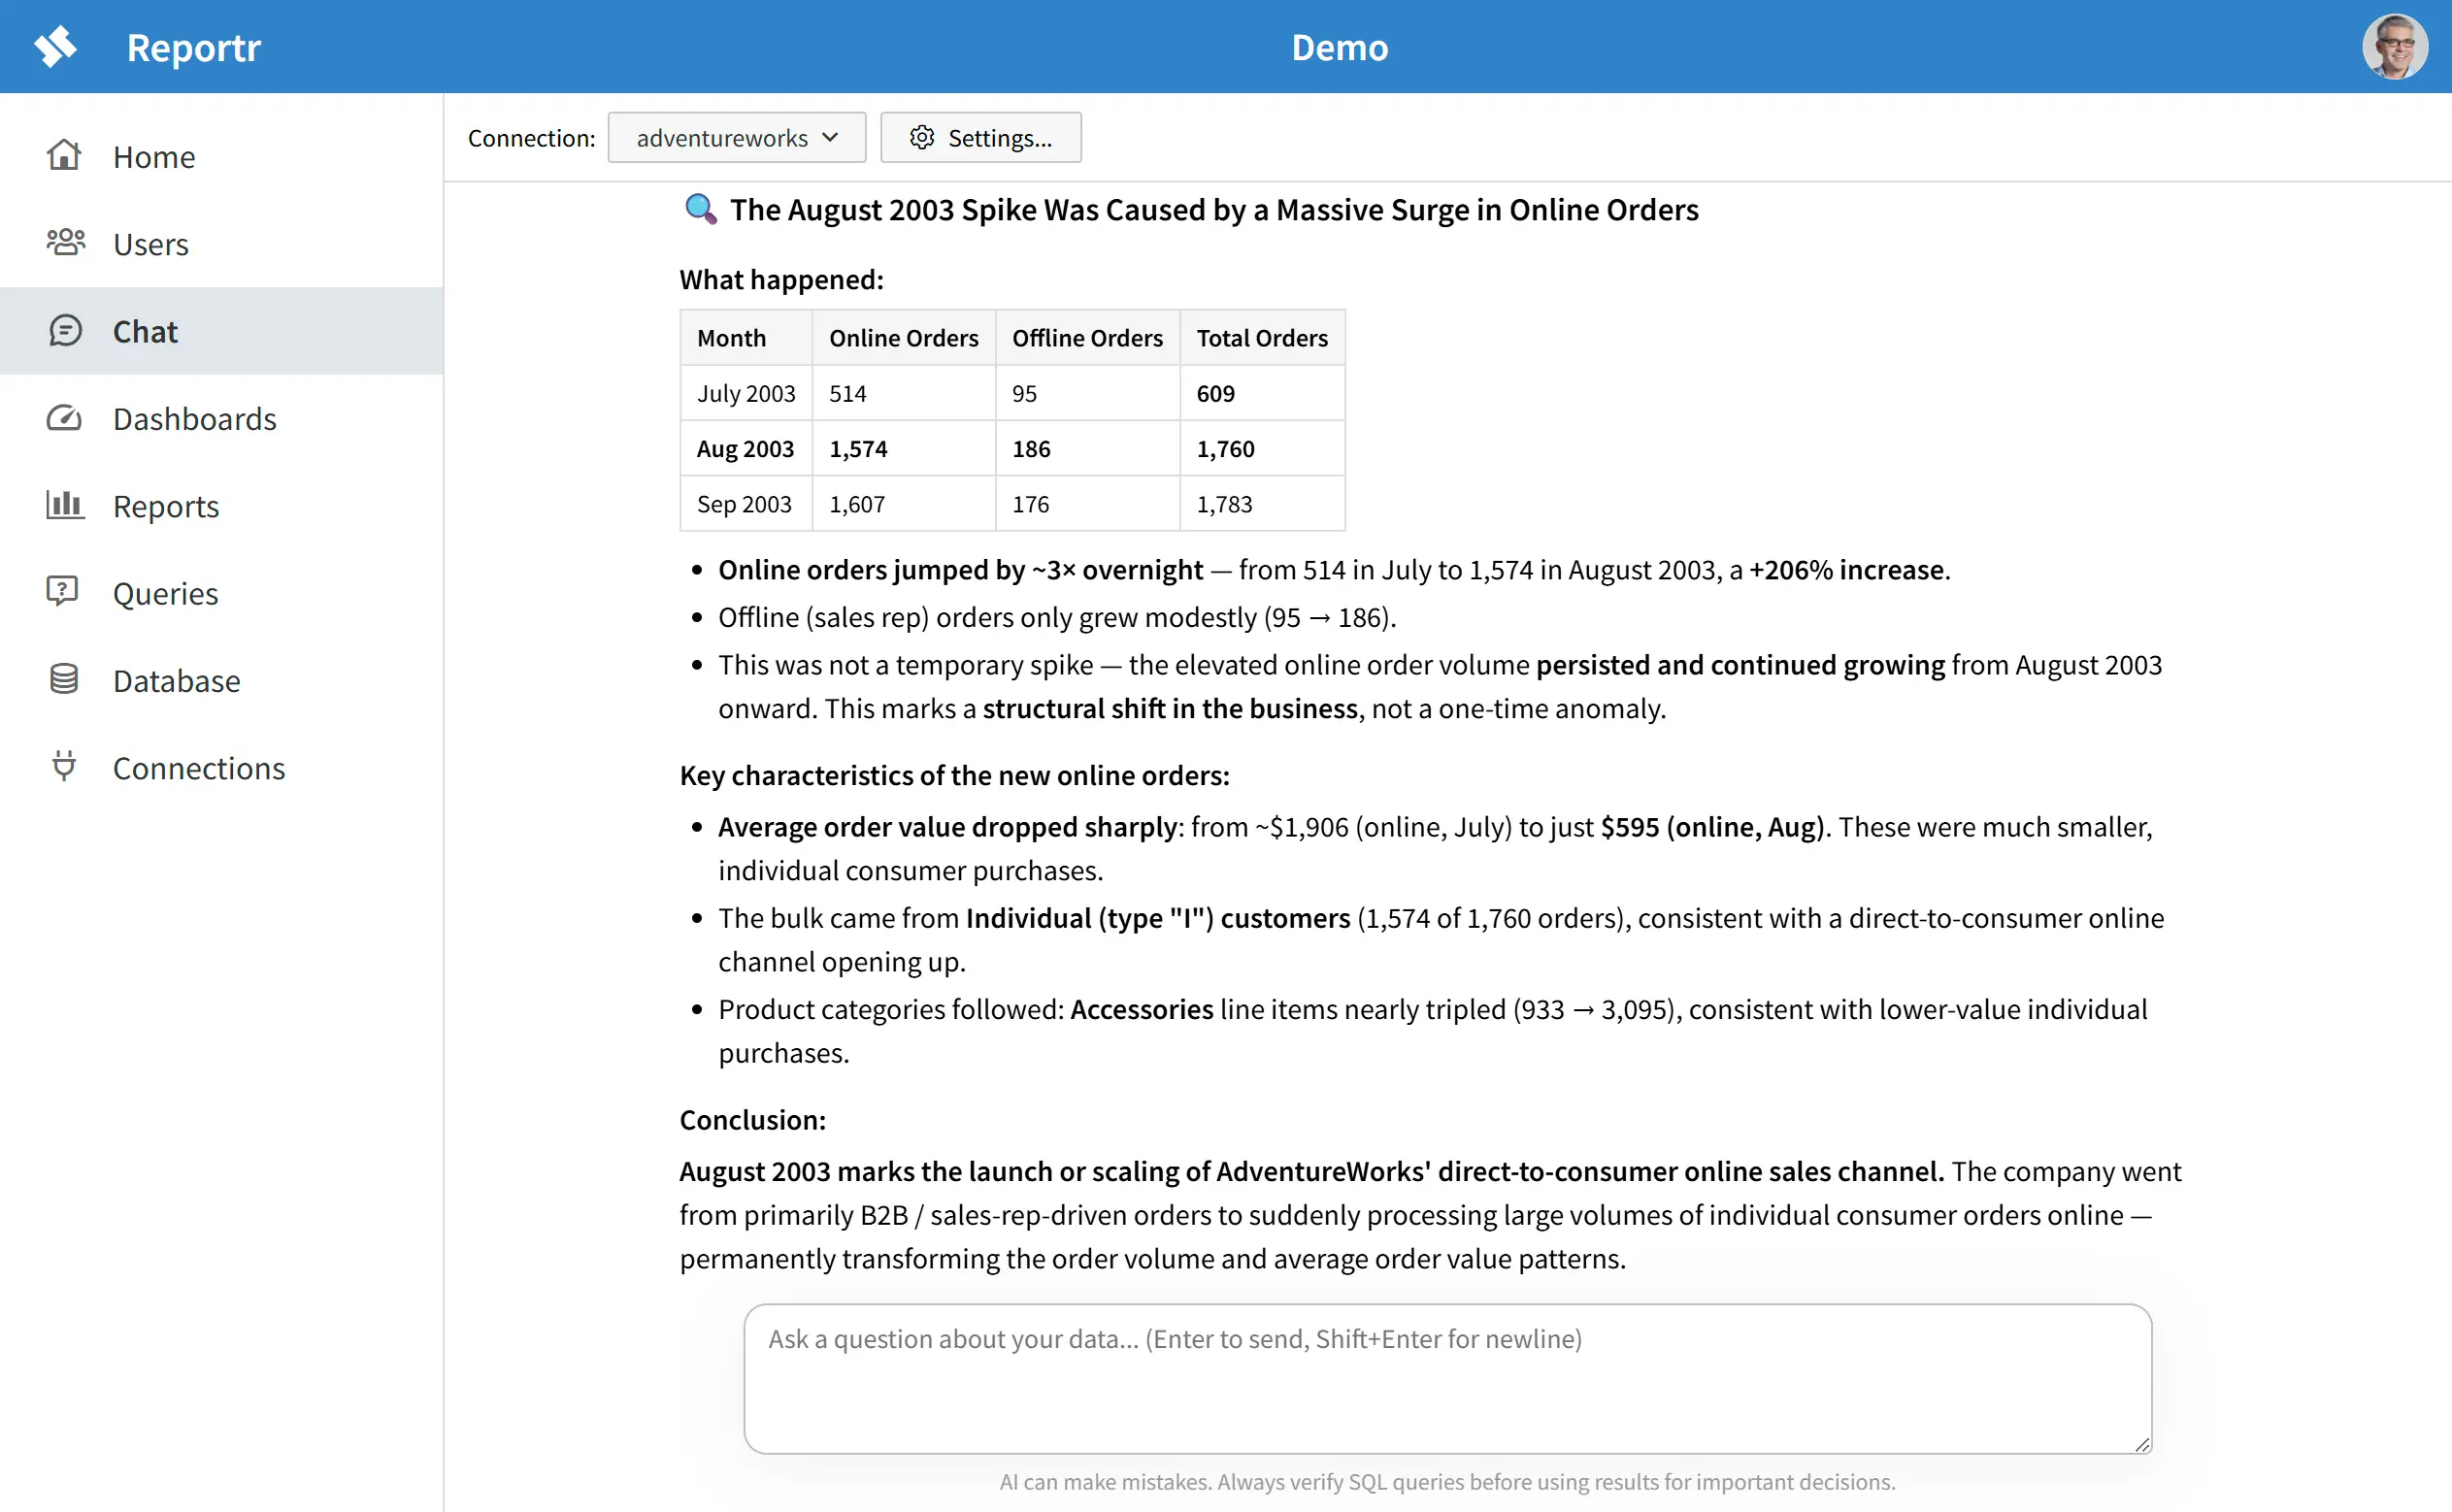
Reportr doesn't just translate your question into a single query — it investigates.
Ask a high-level question, and AI runs a query, examines what comes back, and decides what to check next — slicing and dicing the data every which way until it has an answer. This is agentic analysis: a chain of exploratory queries, each one informed by the last, the same way a human analyst would dig into a dataset.
Example: "I see a spike in Aug 2003. What caused that?" Reportr starts broad — pulls monthly order totals, spots the jump. Splits it by online vs. offline to isolate where the growth came from. Checks average order value, sees it drop. Cross-references customer type, then product category, until the picture is clear. Four queries, each shaped by the last — then, and only then, an answer.
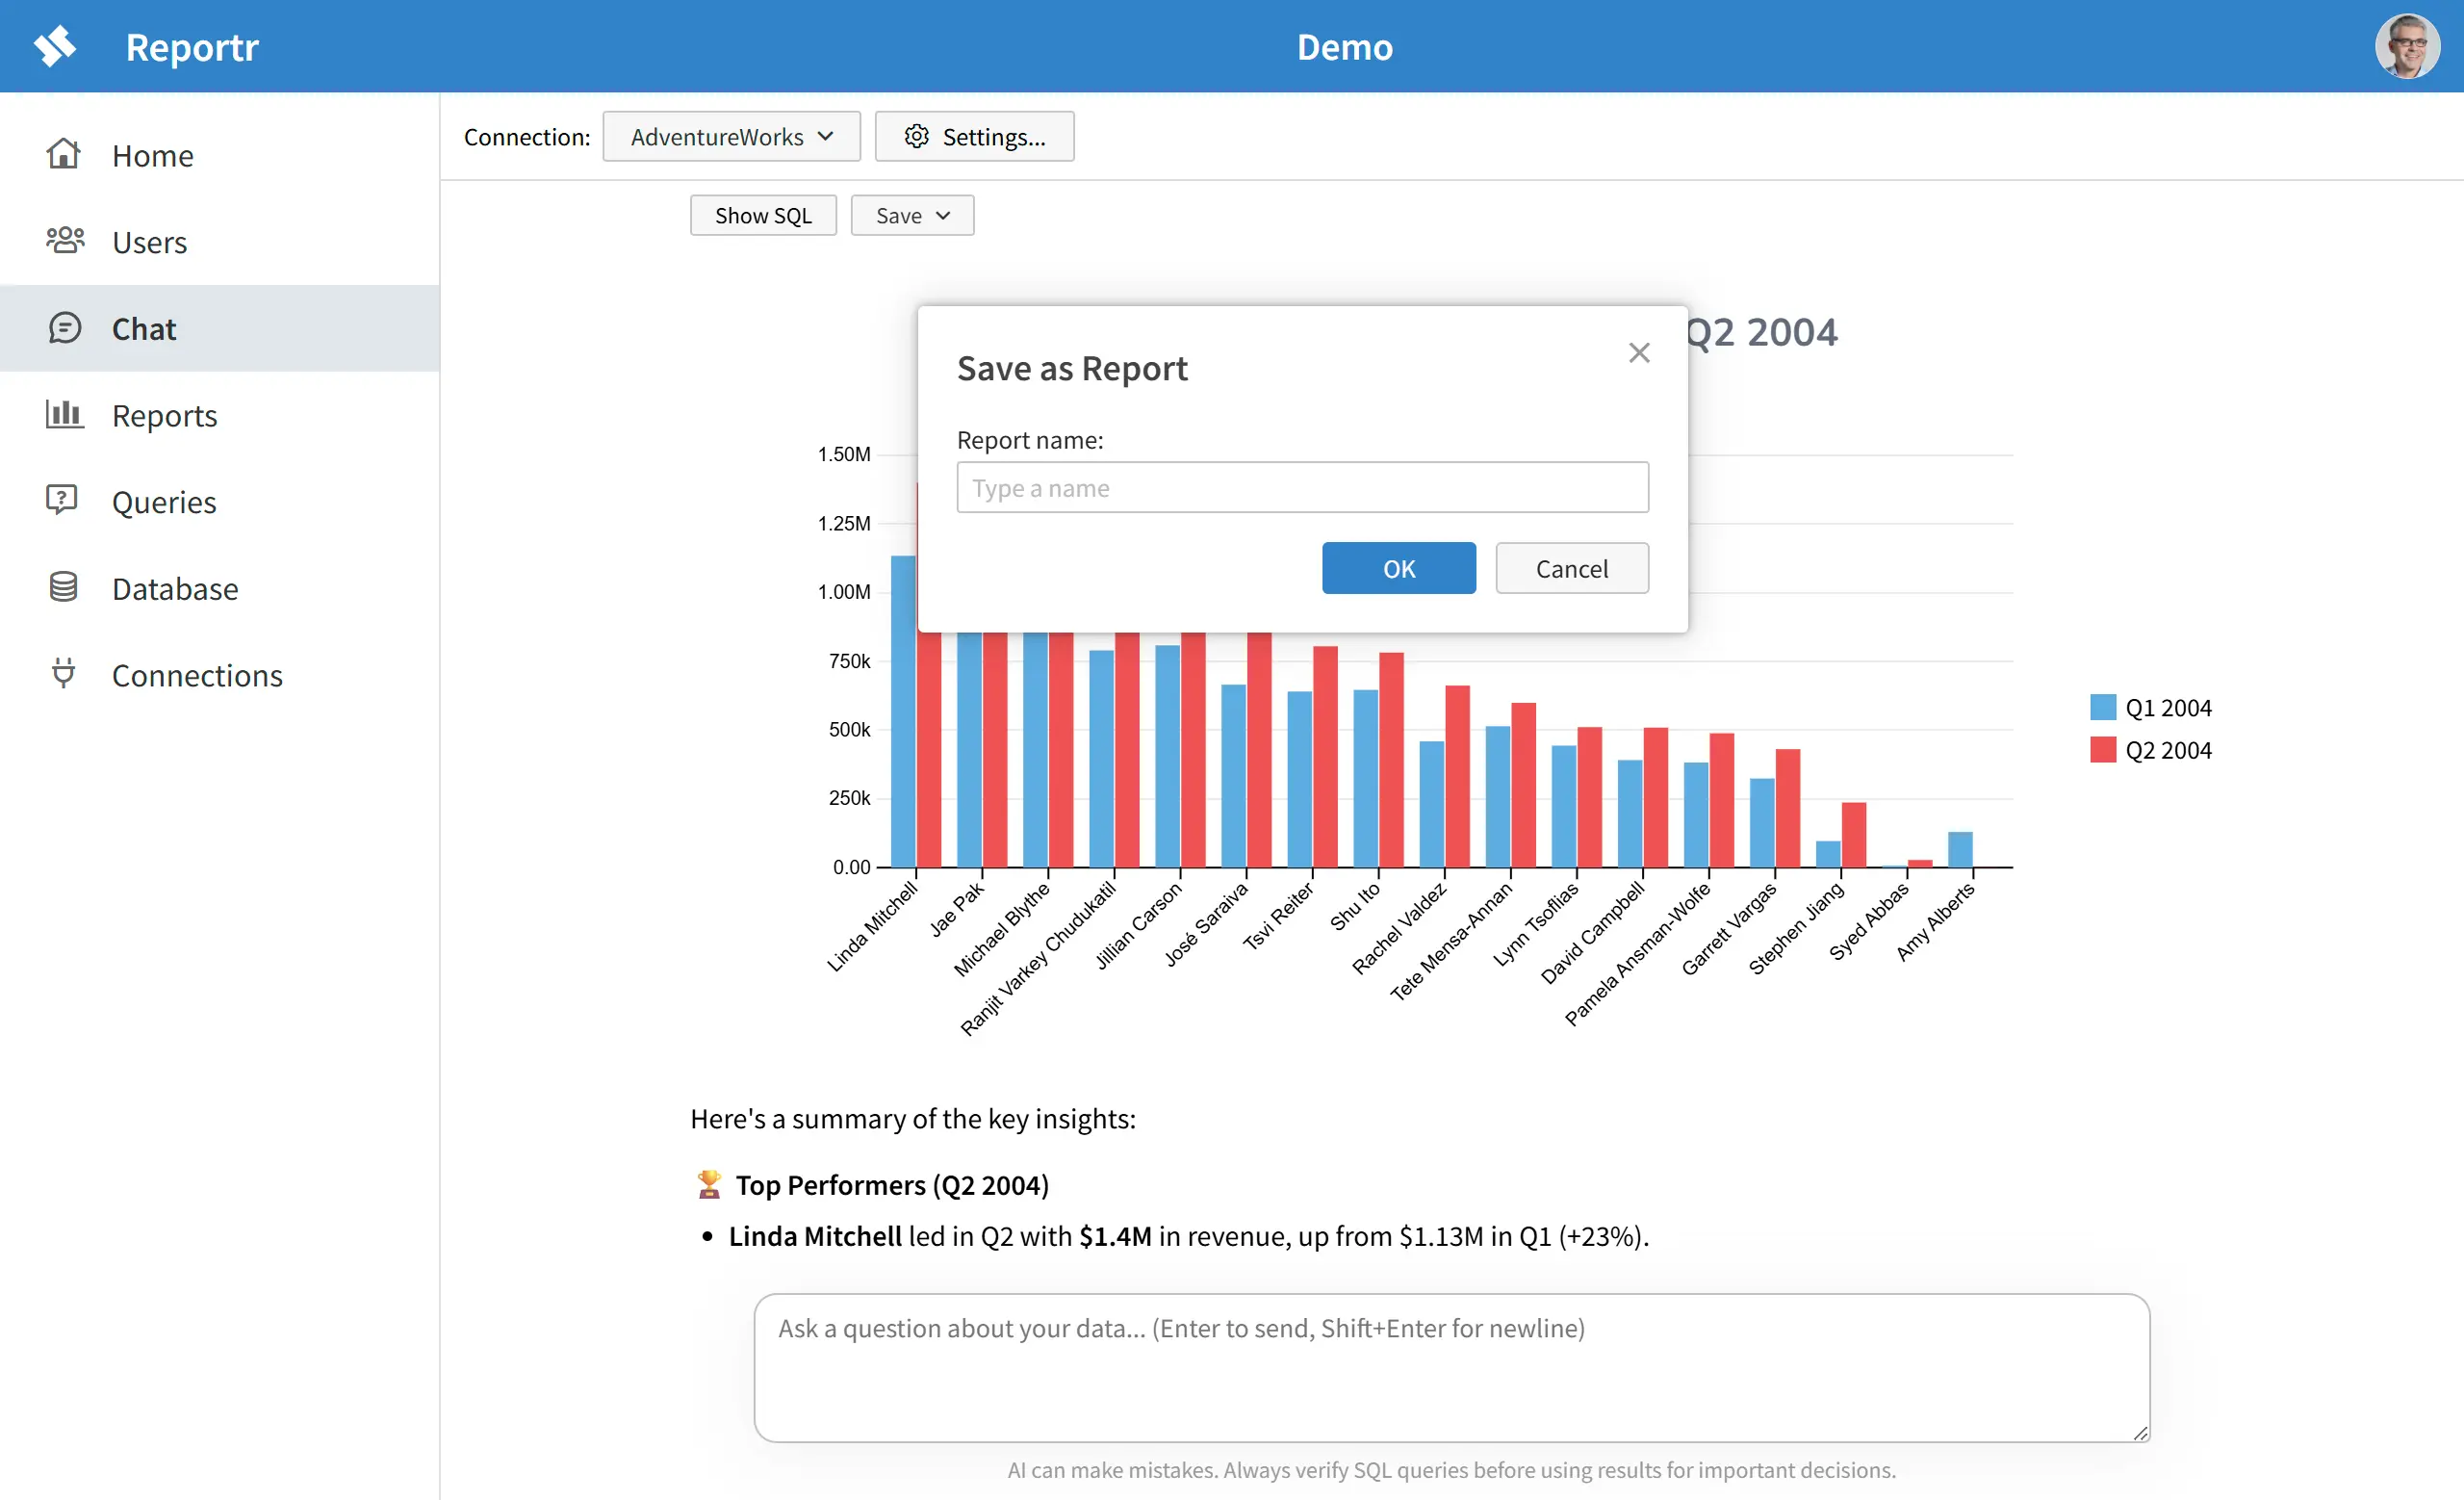
Save insights as reports
Chat is ephemeral. Every conversation starts fresh, and that's fine for exploration — but not for information you need every week.
When a chart or table tells you something you'll want to see again, save it as a report. That result becomes a live, refreshable view — pulling fresh data from your database every time you open it, no conversation required.
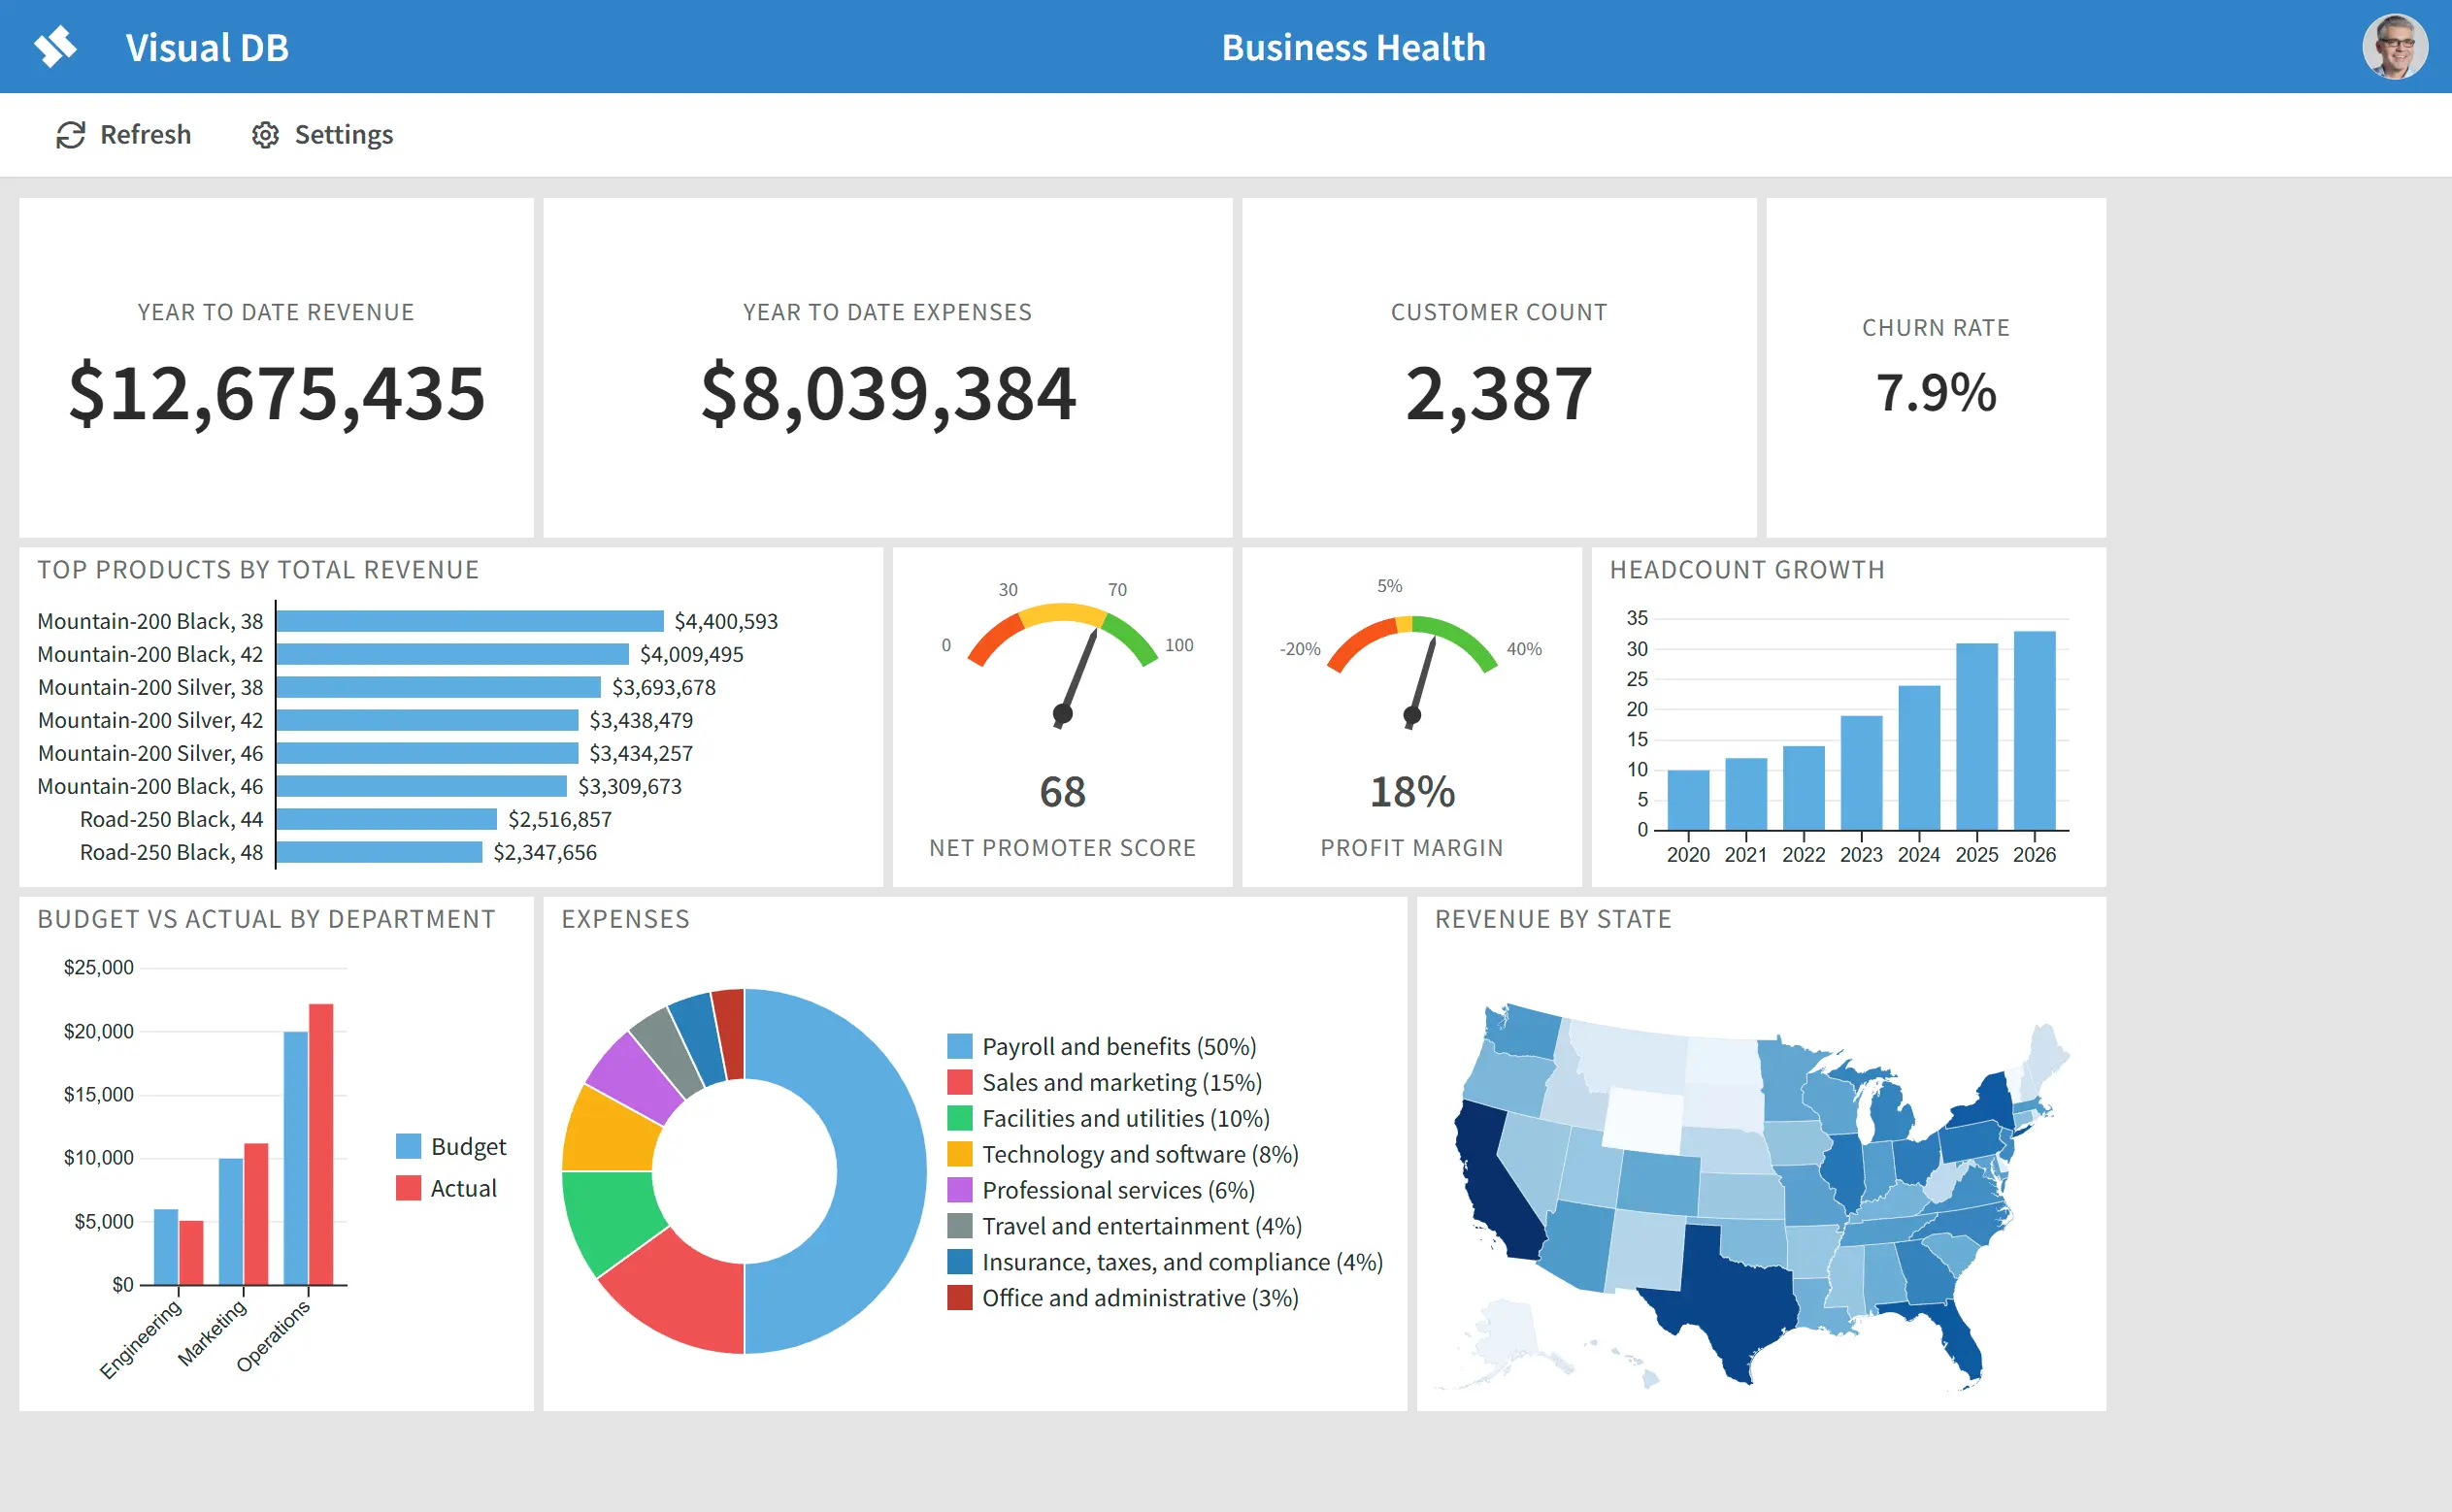
Assemble reports into dashboards
If you can ask a question in chat, you can build a dashboard.
Every chart Reportr generates in chat can be added to a dashboard. Keep asking questions, keep saving interesting visualizations, and in a few minutes you have a monitoring view that would normally take days in a traditional BI tool.
Once added, dashboard tiles stay live — reflecting the current state of your database, not a snapshot from the day you built it.
Full end user reporting
AI chat is Reportr's headline feature, but behind it is a full reporting platform: a visual report builder, tables, charts, parameterized queries, role-based access, and refreshable reports. Everything a business needs to make data accessible to everyone on the team.
This platform stands on its own — build and manage reports and dashboards entirely through the visual builder, no chat or AI required. Use AI when it helps you move faster, or skip it entirely and build reports by hand.
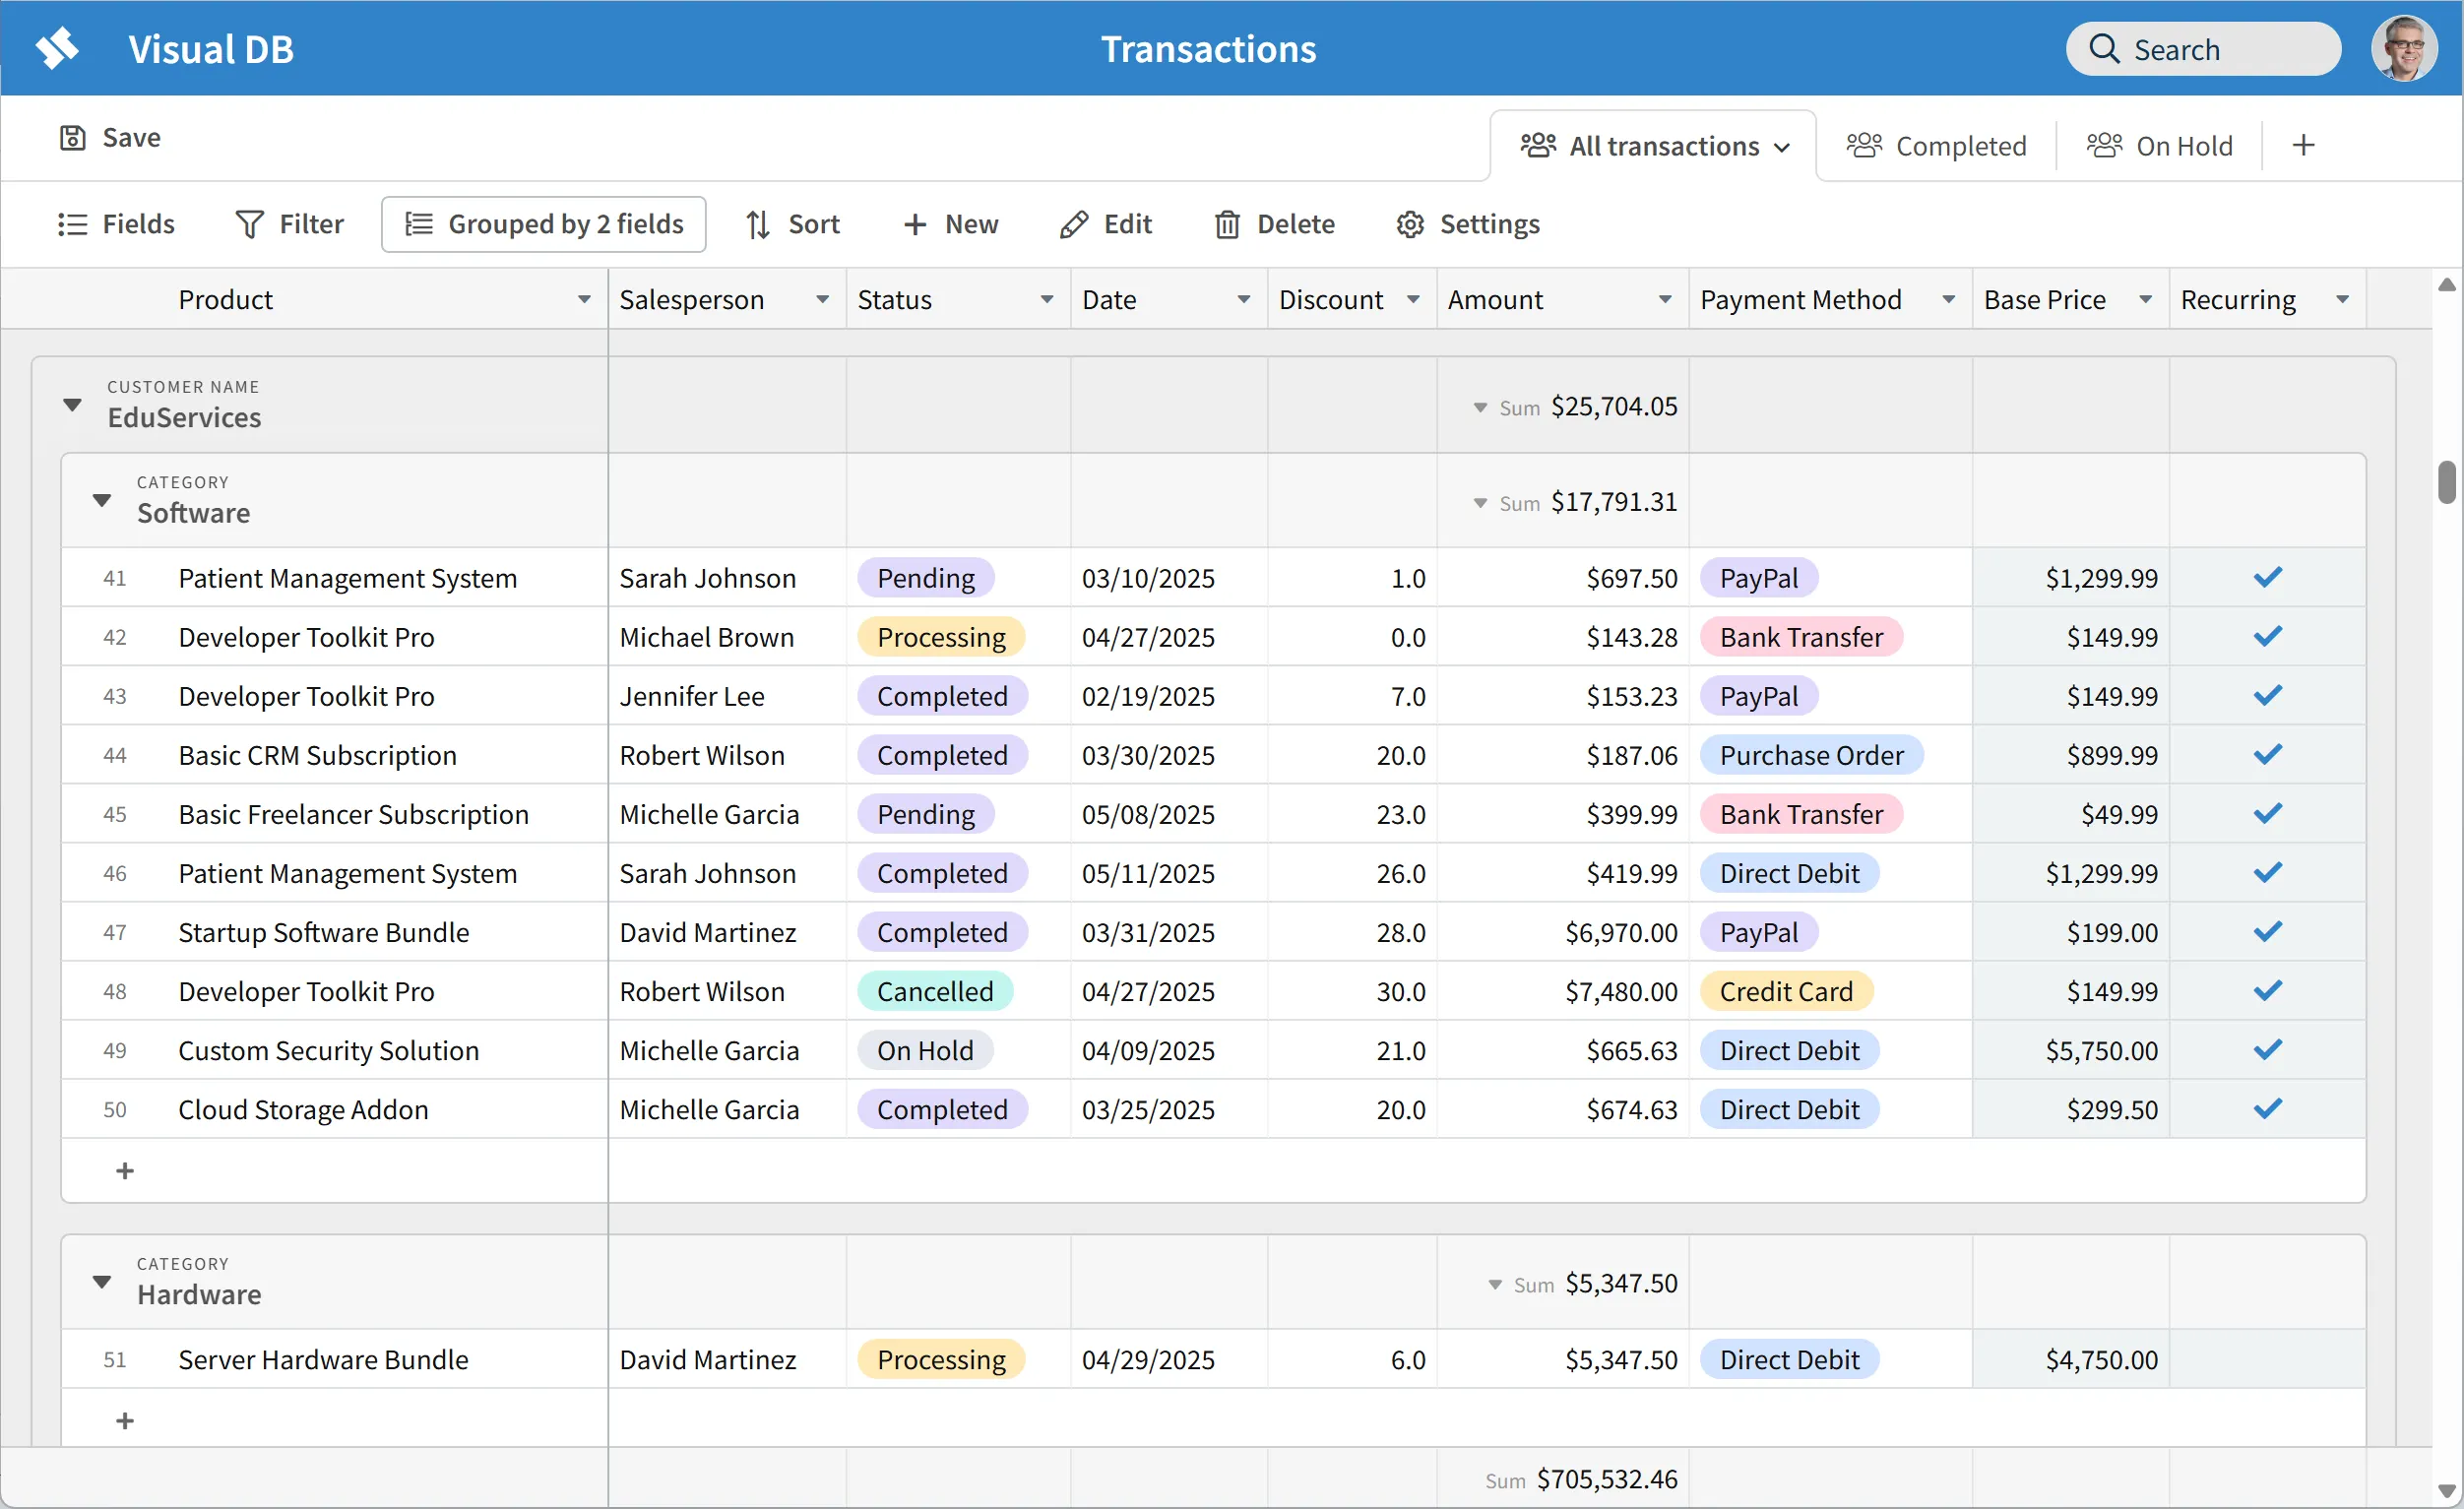
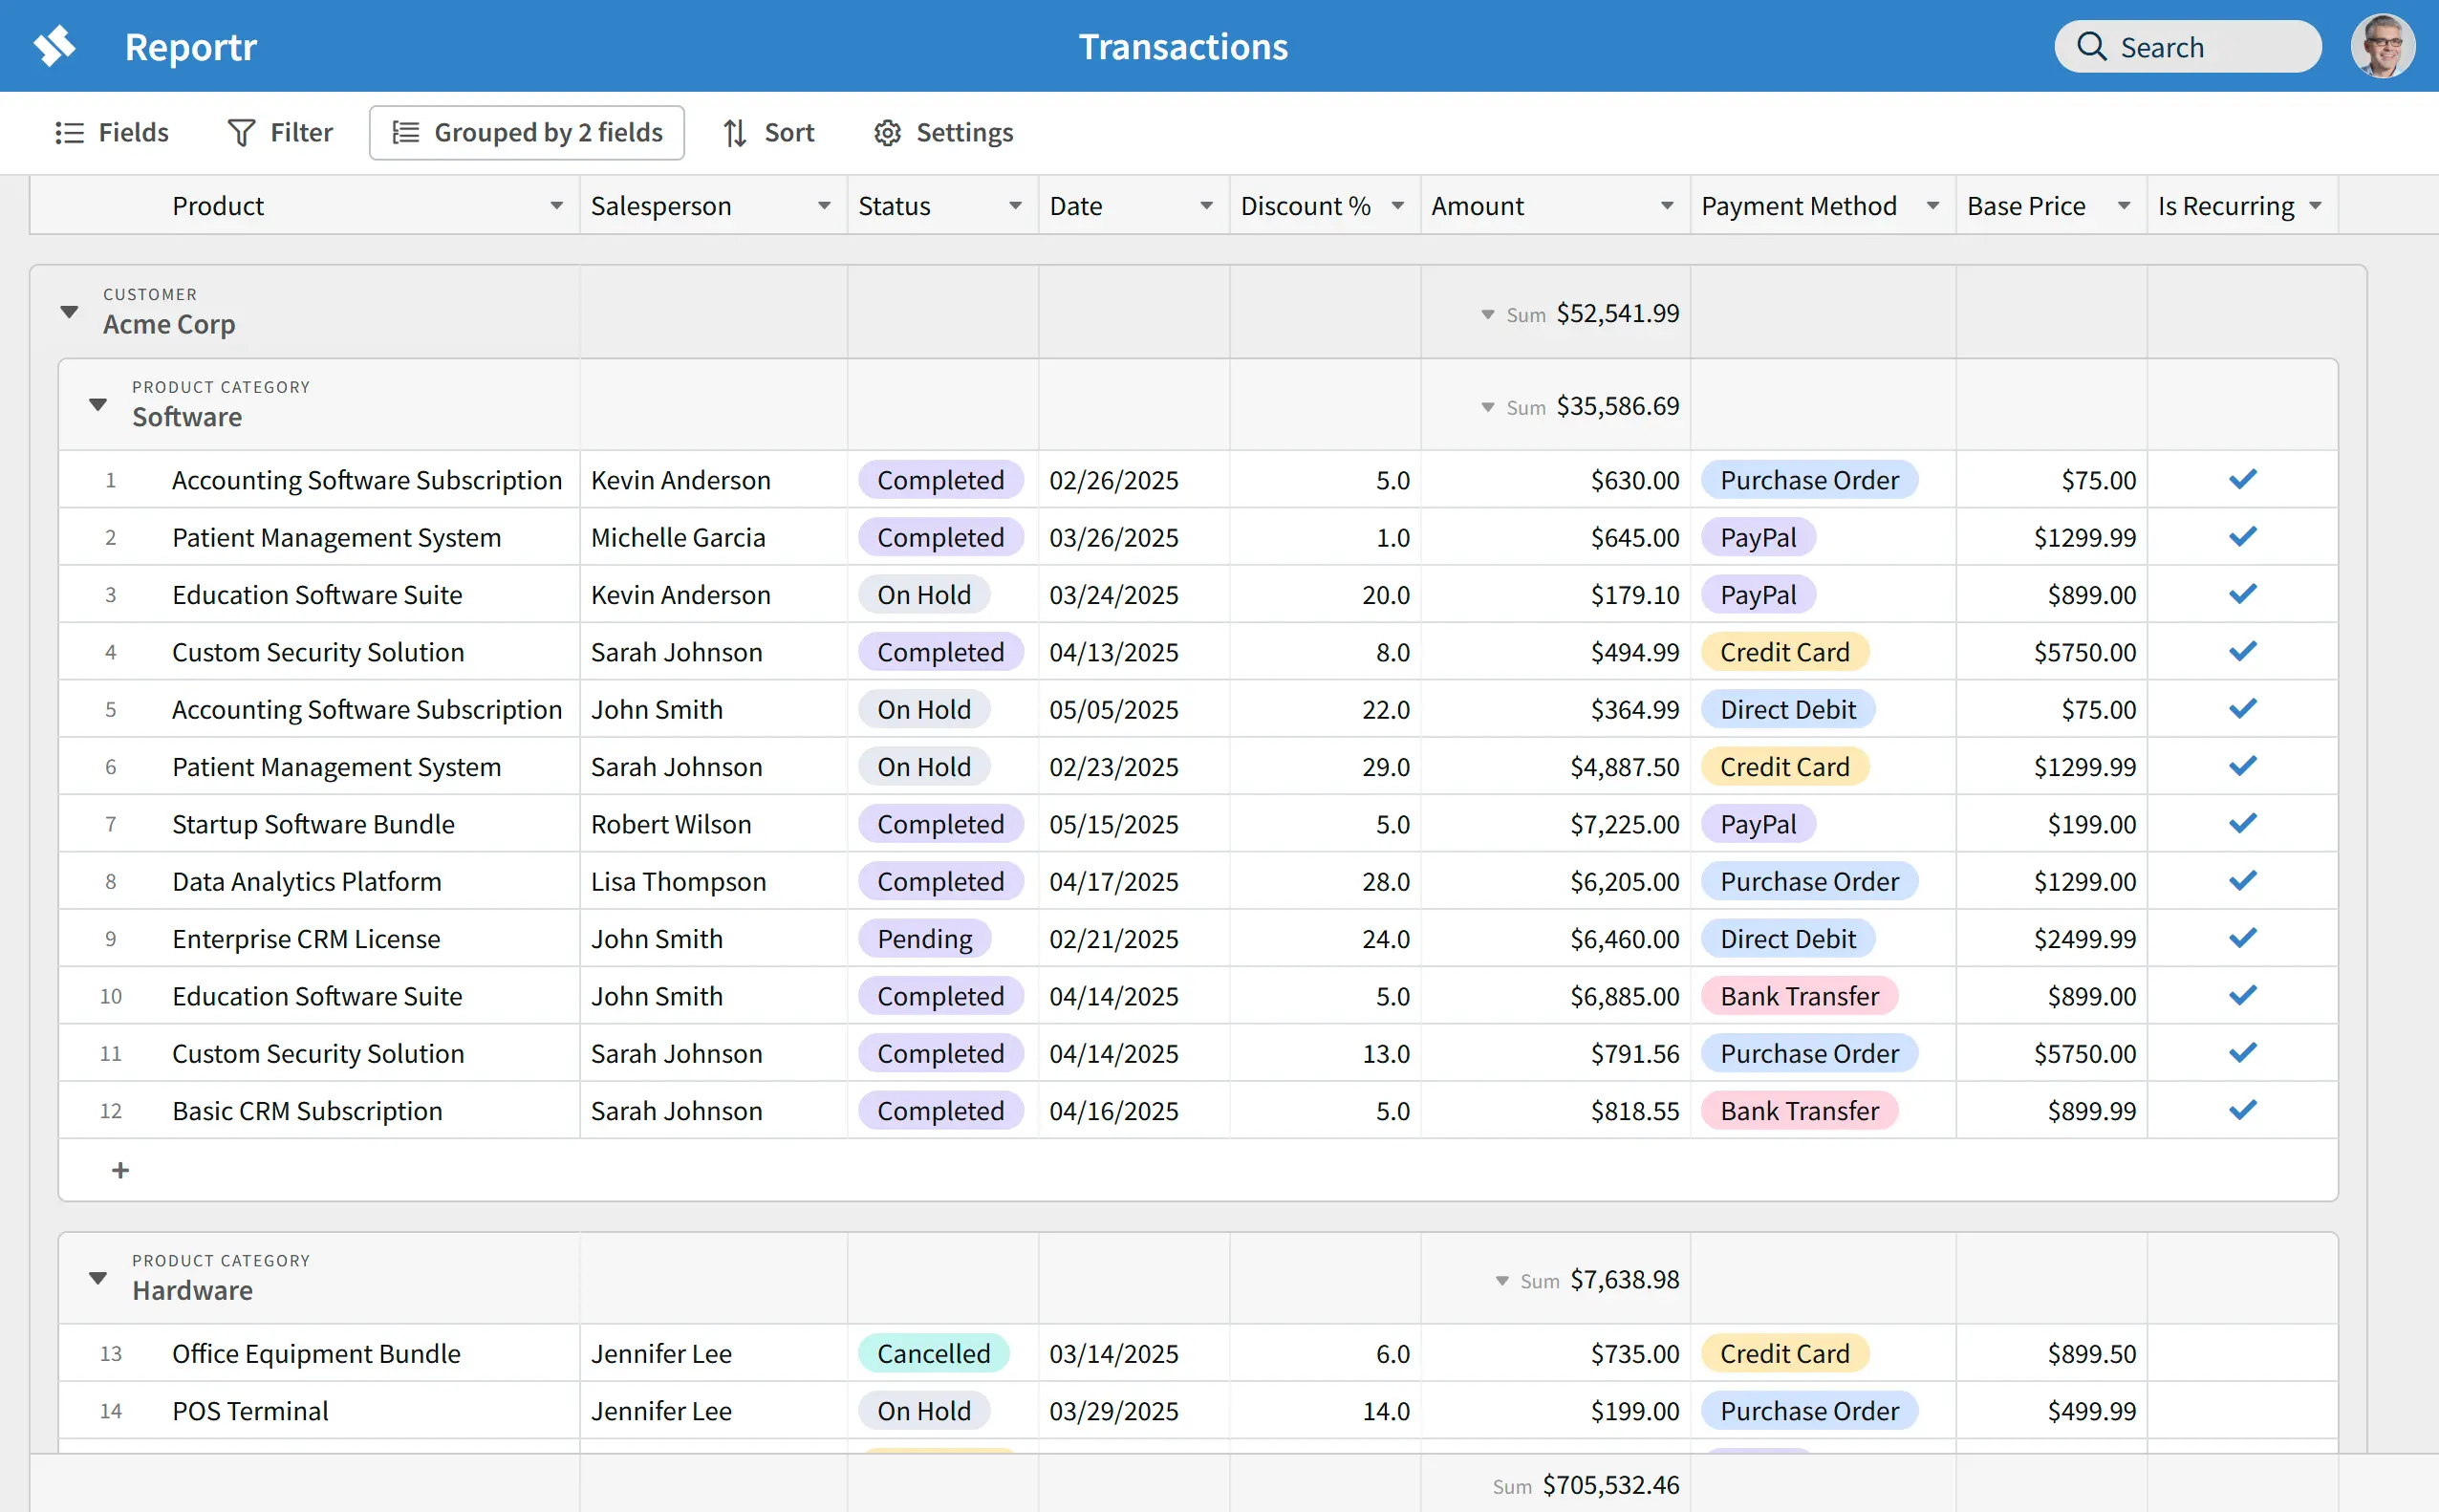
Rich tabular reporting
Tables are the backbone of business reporting. Revenue by region. Orders by customer. Inventory by SKU. Most business questions have a tabular answer — and the ability to sort, filter, and search that data on the fly is what turns a static report into a working tool.
Reportr's table reports support interactive grouping, sorting, and filtering at view time. Resize and reorder columns to suit your layout. And as you type in the search box, matching rows appear instantly — with totals that update to match the filtered rows.
Centralized management
Reportr is a web application — there's nothing to install, nothing to update, and no desktop app to manage across your team.
Reportr keeps your connection details on the server. Users query your data through Reportr without ever seeing a connection string or credentials. You stay in control.
Role-based access control
Not everyone on your team needs the same level of access. Reportr's role-based access control lets you give each user exactly the permissions they need — from view-only access to report building, database management, and full administrative control.
Access is managed at the Application level, so you can tailor permissions separately for each workspace.
Keep your data secure
Reportr can be self-hosted, keeping your data on your own infrastructure and helping you meet stringent data security requirements.
By default, Reportr uses Claude for AI. For organizations with stricter requirements, Reportr also supports self-hosted AI models.
Works with your existing database
Simple, transparent pricing
Start free and scale as you grow. No hidden fees, no surprises.
Free
Perfect for getting started
- Unlimited reports
- AI chat plus end-user reporting
- All supported database types
- Limit of 3 users
Business
per user/month
5 users minimum
- Everything in Free
- No limit to number of users
- All supported database types
- Priority support
14-day free trial
Bring your own key. Supports Claude, OpenAI, and self-hosted models.
Ready to dive in?
Join thousands of teams already boosting their productivity with Reportr